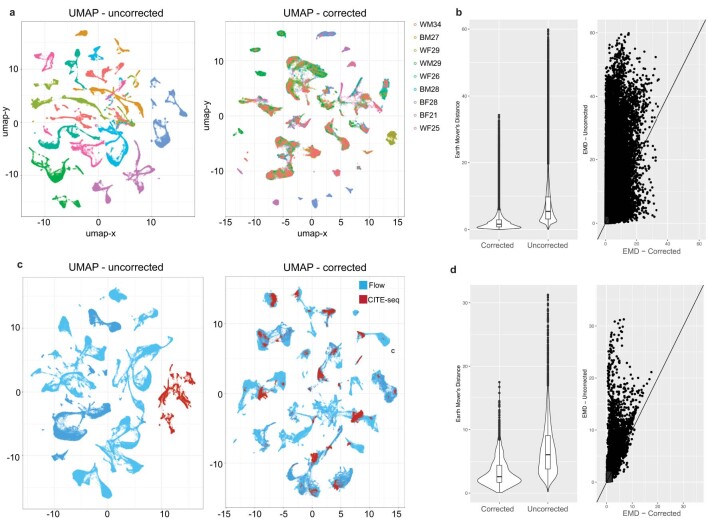
Extended Data Fig. 10. Integration of global CITE-Seq and Infinity Flow antibody profiles.
a, UMAP representation of Infinity Flow objects from each of the 9 different analyzed donors. b, Earth Mover’s Distance (EMD) dissimilarity evaluation of correction within the Infinity Flow data to assess variance between donors (n = 9). c, UMAP indicating the integration of 4 matched CITE-seq and Infinity Flow datasets (n = 4). d, EMD evaluation of correction between CITE-Seq and Infinity Flow for the four matching sample pairs. The Violin plots show the inter-quartile range and outlier cells from the indicated EMD distributions.

