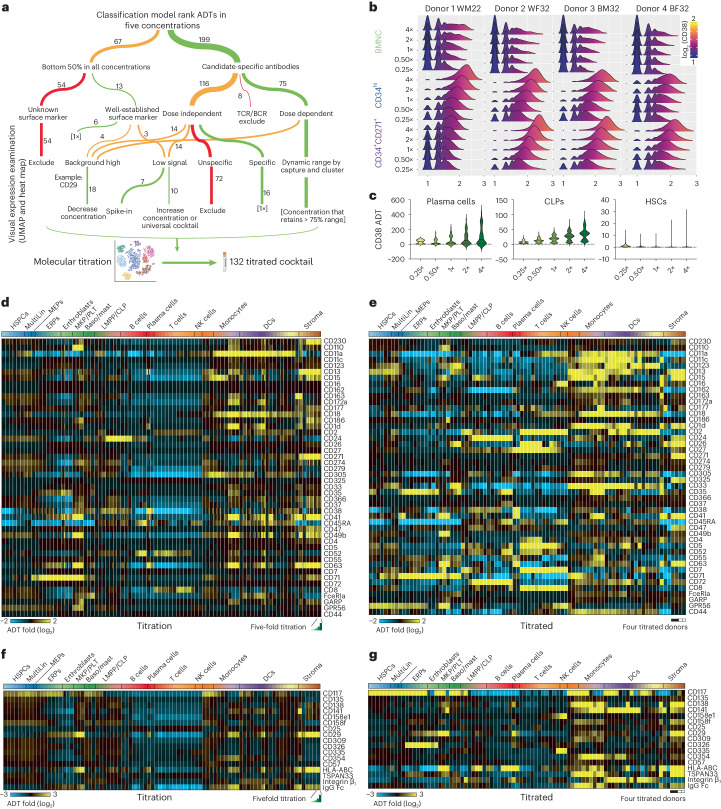
Fig. 2. An optimized antibody cocktail for bone marrow progenitor characterization.
a, Decision tree to nominate ADTs and optimal working concentration; TCR, T cell antigen receptor; BCR, B cell receptor. b, Distribution of CD38 ADT abundance (x axis) with changes in titration by capture and concentration (y axis). c, Cell population-specific detection of CD38 by concentration. d–g, Heat map of ADT expression by cell state and concentration for ADTs with improved detection in the 132 titrated cocktail (e and g) versus the titrations (d and f). ADTs for which concentrations were increased (d and e) or decreased (f and g) in the titrated mix are shown. Each cluster column of titration data (d and f) consists of five columns representing 0.25× to 4× relative to the ‘working’ concentration in the 275-plex titration mix. Each cluster column of titrated data (e and g) consists of four columns representing the donors in the order of African ancestry female, African ancestry male, European ancestry female and European ancestry male, respectively; Baso/mast, basophil/mast cell; PLT, platelets.

