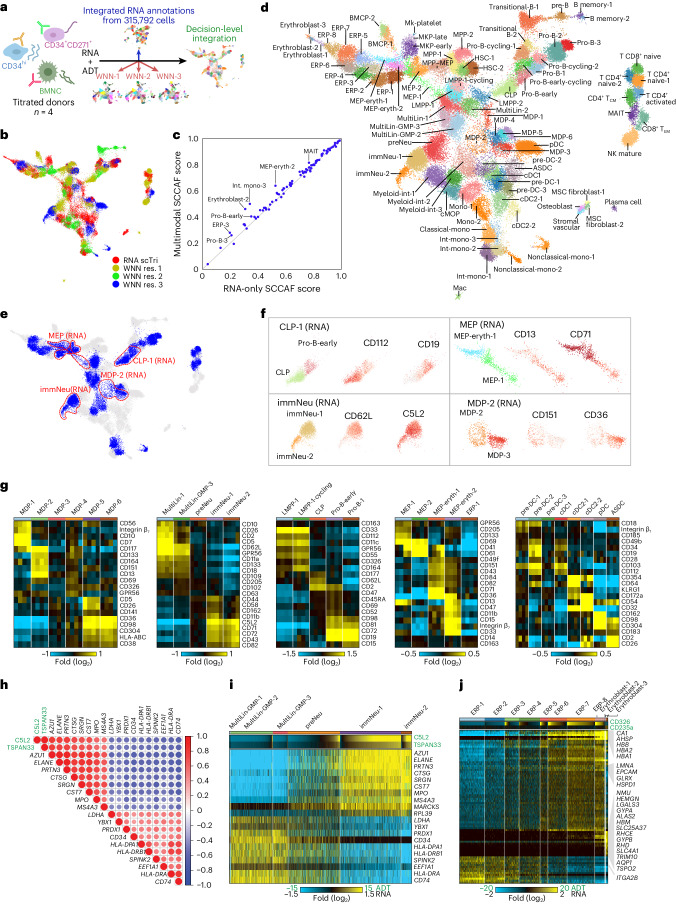
Fig. 3. A multimodal progenitor cell atlas links surface markers with lineage specification.
a, Schematic showing the multimodal cluster integration strategy from multiple clustering resolutions (MUON WNN) and transcriptome-defined cell states (scTriangulate). b, The most stable clusters defined by annotation source in the final scTriangulate (scTri) integration. c, Reclassification accuracy (SCCAF statistic) for the final scTriangulate clusters with (multimodal) and without considering ADT (RNA only). d, UMAP projection and annotation of the final 89 scTriangulate clusters. e, UMAP indicating multimodal scTriangulate clusters that were further separated with the addition of ADTs versus transcriptome-only clustering (see Fig. 1c). ‘Split’ clusters are indicated in blue, and populations outlined in red correspond to those in f. f, UMAP of example cell populations selectively resolved by the addition of ADTs. Exemplar ADTs are shown; red, relative expression; gray, no expression. g, Heat map of distinguishing ADT markers (MarkerFinder algorithm) for selected predicted lineage subsets. h, Pearson pairwise gene and ADT correlation similarity matrix dot plot for the top correlated and anticorrelated genes with C5L2 and TSPAN33 ADT expression among GMPs, preNeu and immNeus; green, ADTs. i, Heat map showing the relative abundance of C5L2 and TSPAN33 in granulocyte progenitors and correlated marker gene relative expression (median normalized). j, Heat map showing the relative abundance of CD326 and CD235a in ERPs and correlated marker gene relative expression (median normalized); eryth, erythroid; cMOP, common monocyte progenitor; cDC, classical DC.

