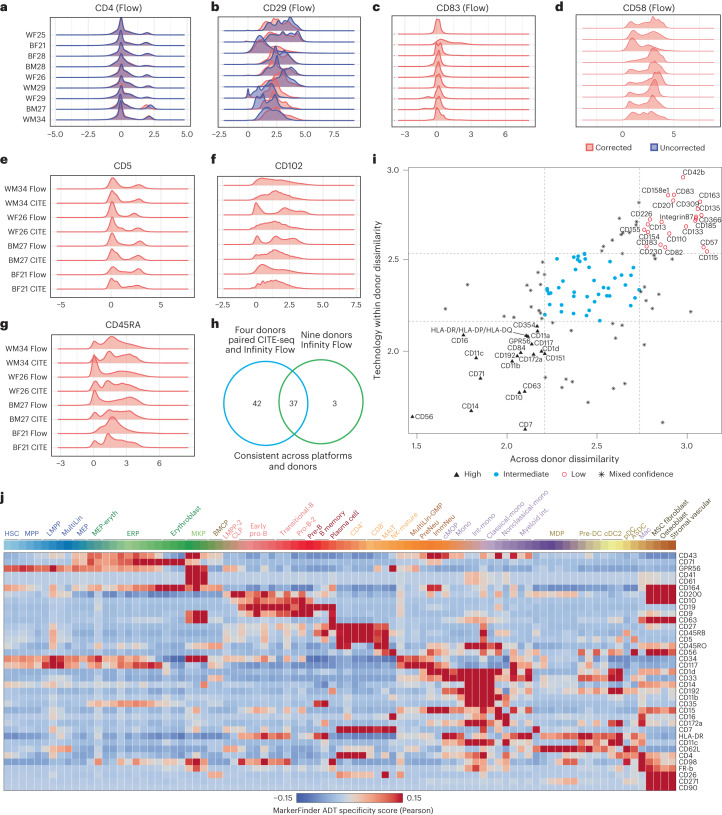
Fig. 5. Variation of surface marker expression across donors and between technologies.
a, Consistent expression pattern of CD4 presented in a ridge plot before and after correction in nine donors. b, Inconsistent expression of CD29 presented in a ridge plot before and after correction in nine donors. c, CD83 corrected expression presented in a ridge plot is consistent across eight donors. d, CD58 corrected expression presented in a ridge plot is inconsistent across donors. e, Consistent expression of CD5 across technologies and donors. f,g, Varied expression distribution in both donors and across technologies (CD102 (f) and CD45RA (g)). h, Venn diagram showing surface markers that exhibit consistent expression across donors and technologies by ridge plot distribution visualization. i, Surface marker expression dissimilarity examined by Anderson–Darling testing. Across donor (x axis) and technology within donor (y axis) distribution dissimilarity for n = 132 markers (see Methods). Dissimilarity values are the log10-transformed values of the Anderson–Darling test t values. j, Heat map showing the correlation of 37 highly consistent surface markers from h with multimodal clusters from titrated data. The batch effect correction was performed with cyCombine; pDC, plasmacytoid DC.

