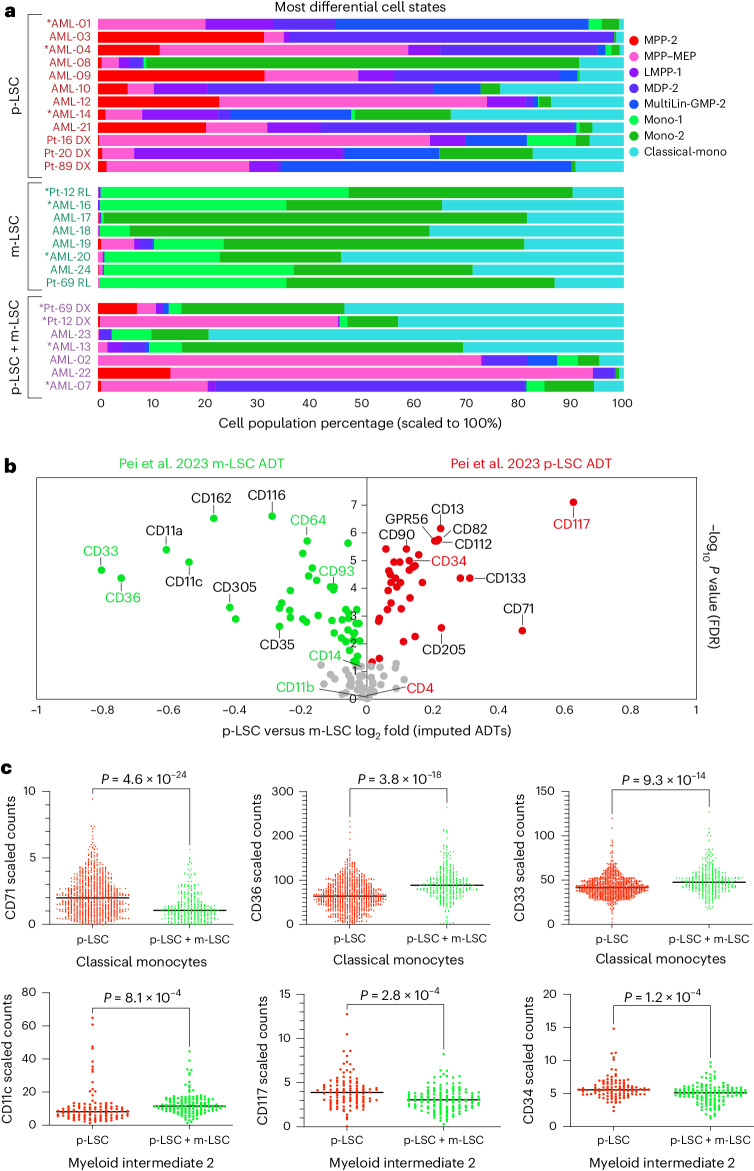
Fig. 6. AML LSCs align with distinct healthy multilineage progenitors.
CITE-seq bone marrow biopsies from individuals with AML with prior evidence of p-LSCs (sensitive to venetoclax/azacytidine), m-LSCs (resistant to venetoclax/azacytidine) or both (p-LSCs + m-LSCs) aligned to our multimodal atlas (Azimuth). a, Cell frequency was compared between AML captures. Asterisks (*) indicate that the sample LSC type was validated by xenograft. b, Differences in imputed cell surface ADT abundance (Azimuth) comparing p-LSC to m-LSC AML CITE-seq biopsies. Corresponding differentially expressed ADTs from the original study CITE-seq datasets34 are indicated in green (m-LSC enriched) or red (p-LSC enriched). c, Example of differentially expressed surface markers in p-LSC (n = 2) versus p-LSC + m-LSC (n = 1) samples for ADT TotalVI scaled counts within the indicated mapped cell states. Dots represent individual cells. Displayed P values were computed from a two-sided empirical Bayes moderated t-test (FDR corrected).

