Fig. 1.
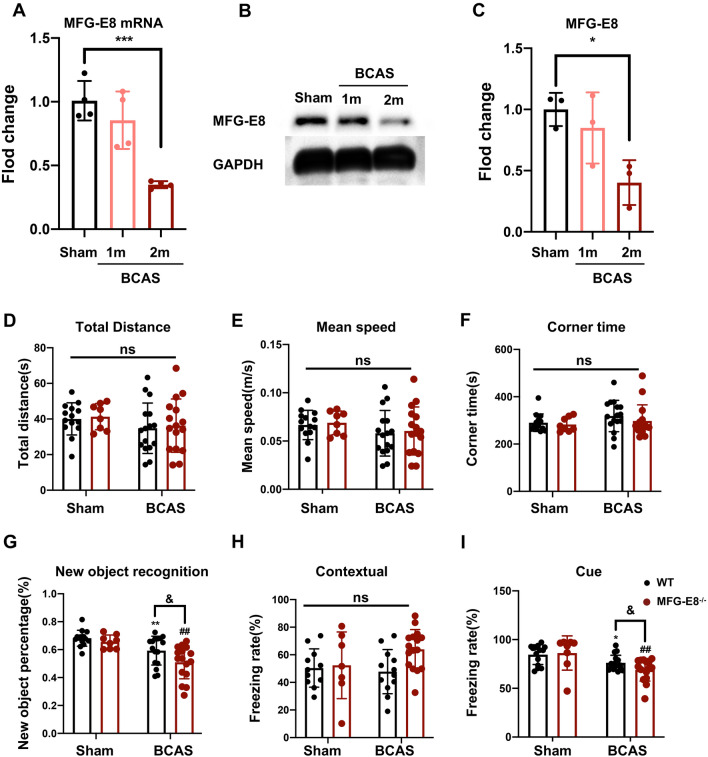
MFG-E8 expression decreases after BCAS and MFG-E8 deficiency worsens the BCAS-induced cognitive impairment. A Quantitative RT-PCR analysis of MFG-E8 mRNA from sham, BCAS 1 month, and BCAS 2 months mice (n = 4 per group, ANOVA) ***P < 0.001. B Representative Western blots of MFG-E8 expression. C Densitometry analyses of MFG-E8 expression normalized to GAPDH (n = 3, ANOVA, *P < 0.05). D–F The total distance, mean speed, and corner time in the open field test (ns, no significant difference). G The exploratory preference for novel objects in the new object recognition test (***P < 0.001 vs WT sham group, ****P < 0.0001 vs WT sham group, #P < 0.05 vs WT BCAS group. H, I The freezing rate in the contextual cued fear conditioning test (H) and the cued contextual fear conditioning test (I) (n = 8–16 mice, unpaired t-test; *P < 0.05 vs WT sham group, ***P < 0.001 vs WT sham group, ##P < 0.01 vs MFG-E8 −/− sham, &P < 0.05 vs WT BCAS group. All data represent the mean ± SD.

