Fig. 2.
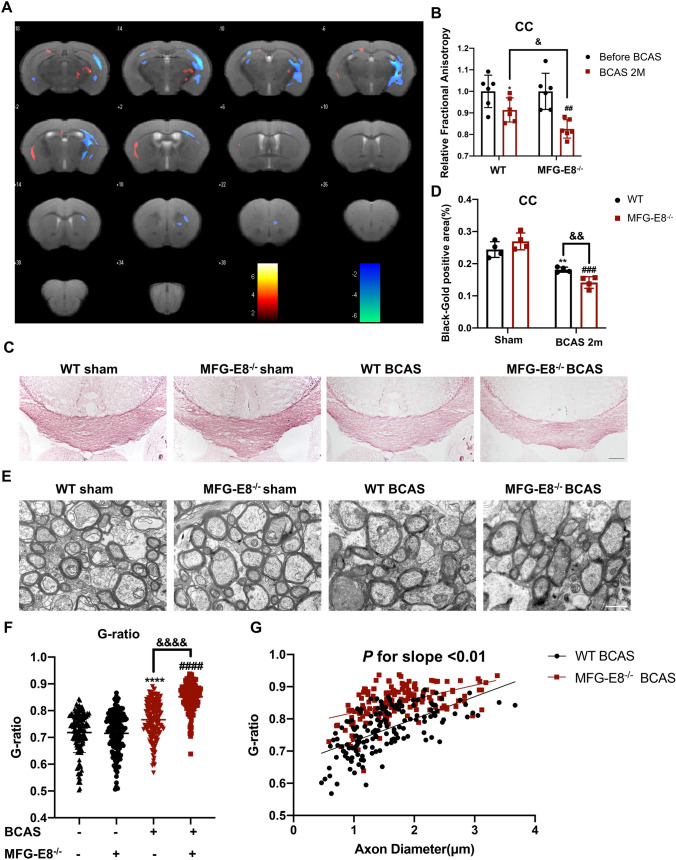
MFG-E8 knockout exacerbates white matter damage after BCAS. A Heatmaps generated from DTI axial views of FA acquired from WT and MFG-E8−/− mice at 2 months after surgery. B Quantification of FA values in the corpus callosum in the WT sham, WT BCAS, MFG-E8−/− sham, and MFG-E8−/− BCAS groups at 2 months after surgery. The values were normalized to the mean value of the sham group (n = 6 per group; *P < 0.05 vs WT sham, paired t test; ##P < 0.01 vs MFG-E8−/− sham, paired t test; &P < 0.05 vs WT BCAS, unpaired t test). C Representative images of black-gold staining (lavender) in the corpus callosum at day 60 after BCAS. Scale bar: 200 μm. D Quantification of the immunofluorescent intensity of black-gold staining area in the CC (n = 4, unpaired t-test; **P < 0.01 vs WT sham, ###P < 0.001 vs MFG-E8−/− sham, &&P < 0.01 vs WT BCAS). E Representative electron microscopy images in the CC. Scale bar: 1 μm. F Quantification of G-ratios (n = 153 for WT sham mice, n = 144 for MFG-E8−/− sham mice, n = 154 for WT BCAS mice, n = 156 for MFG-E8−/− BCAS mice; ****P < 0.0001 vs WT sham, ####P < 0.0001 vs MFG-E8−/− sham, &&&&P < 0.0001 vs WT BCAS, unpaired t-test). G Scatterplots of the myelin g-ratio as a function of axon diameter in the corpus callosum in the WT and MFG-E8−/− BCAS groups at 2 months after surgery. Axons were measured from 4 mice per group (n = 154 for WT BCAS mice, n = 156 for MFG-E8−/− BCAS mice, Mann–Whitney U-test). All data are presented as the mean ± SD.

