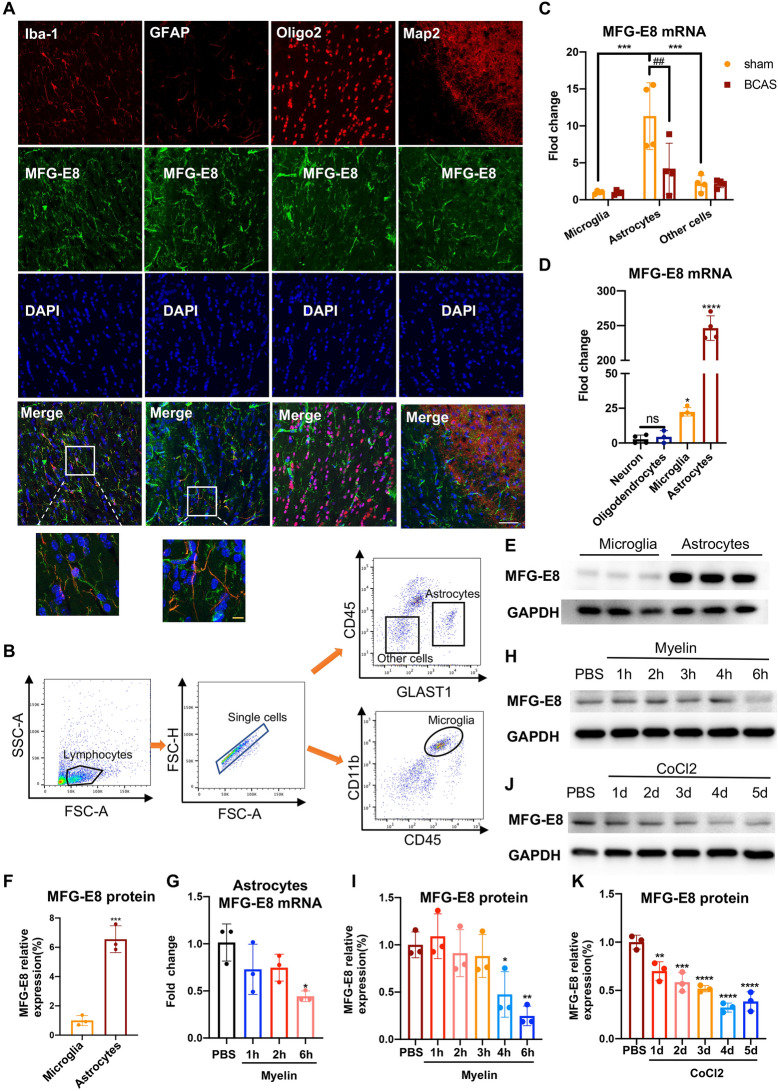
Fig. 7.
MFG-E8 is mainly expressed and secreted by astrocytes in the central neuronal system. A Representative immunofluorescence co-staining images of MFG-E8/Iba-1, MFG-E8/GFAP, MFG-E8/Oligo2, and MFG-E8/Map2 in the CC of WT sham mice. Microglia, astrocytes, oligodendrocytes, and neurons are labeled with Iba-1, GFAP, Oligo2, and Map2, respectively. White scale bar: 50 μm; orange scale bar: 10 μm. B Gating strategy for flow cytometry and FACS-sorting. C The mRNA levels of MFG-E8 in the microglia, astrocytes, and other cells from WT mice in the Sham and BCAS groups by qPCR (n = 4 per group; ***P < 0.001 vs astrocytes in sham group, ##P < 0.01 vs astrocytes in BCAS group, two-way ANOVA). D MFG-E8 mRNA expression in primary neurons, oligodendrocytes, microglia, and astrocytes without any treatment (n = 4 repeats per group; *P < 0.05, ****P < 0.0001 vs neurons, ANOVA). E, F Immunoblot bands (E) and quantification (F) of MFG-E8 expression in primary microglia and astrocytes with GAPDH as a loading control (n = 3 repeats per group; ***P < 0.001 vs microglia, unpaired t-test). G MFG-E8 mRNA expression in primary astrocytes at different time points after myelin stimulation (n = 3 per repeats group; *P < 0.05 vs PBS group, ANOVA). H, I Representative immunoblots (H), and densitometry analyses (I) of MFG-E8 expression in primary astrocytes at different time points after myelin stimulation (n = 3 per repeats per group; *P < 0.05, **P < 0.01 vs PBS group, ANOVA). J, K Representative immunoblots (J), and densitometry analyses (K) of MFG-E8 expression in primary astrocytes at different time points after CoCl2 stimulation (n = 3 repeats per group; **P <0.01, ***P < 0.001, ****P < 0.0001 vs PBS group, ANOVA. All data are presented as the mean ± SD).

