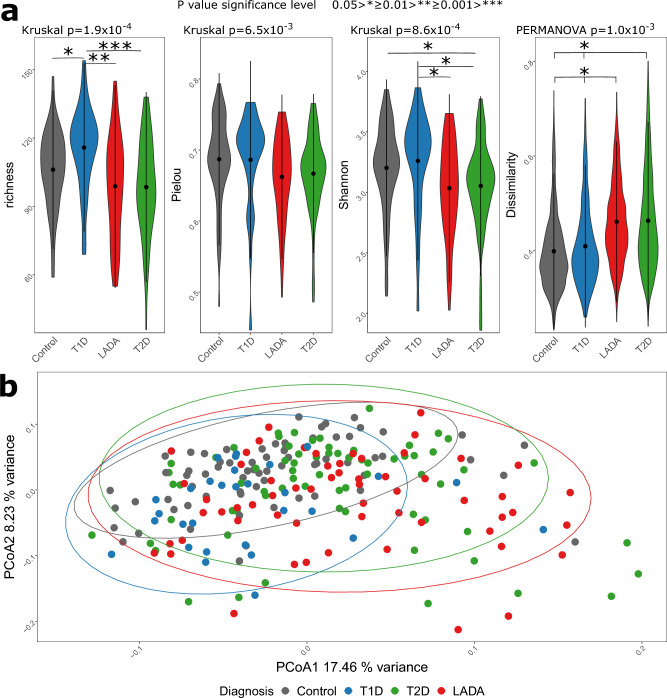
Figure 1.
Exploration of differences between diagnostic groups investigating alpha and beta-diversity parameters (a), and by PCoA (b). Alpha-diversity was visualized with violin plots and included richness, Pielou’s evenness, and Shannon diversity. A non-parametric overall comparison of diagnostic groups was performed using the Kruskal–Wallis test. If significant, a follow-up pairwise comparison of groups was performed with the Mann–Whitney test and p-values were Bonferroni corrected. Bray–Curtis dissimilarity calculated from Hellinger transformed total sum scaled data was used as beta-diversity measure and the violin plot represented the within group variation. PERMANOVA was used to compare all diagnostic groups and follow-up pairwise comparison of diagnostic groups where p-values were Bonferroni corrected. PCoA were used to visualize dissimilarities of all samples. Variance explained by the first two axes were included in their labels. Violin plots of beta-diversity represented within diagnostic group dissimilarity.

