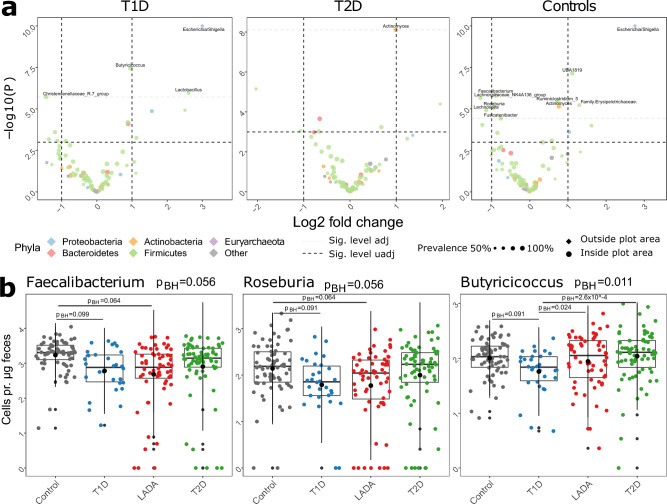
Figure 2.
Differences in specific genera observed between diagnostic groups, Volcano plot showing results from the differential abundance analysis (a), and boxplots of selected genera (b). Differential abundance tests were performed with cell counts as normalization factors in DESeq2 performing both likelihood ratio test, comparing all diagnostic groups, and a Wald test to make pairwise comparisons between diagnostic groups. p-values in the Wald test were Benjamini–Hochberg corrected.

