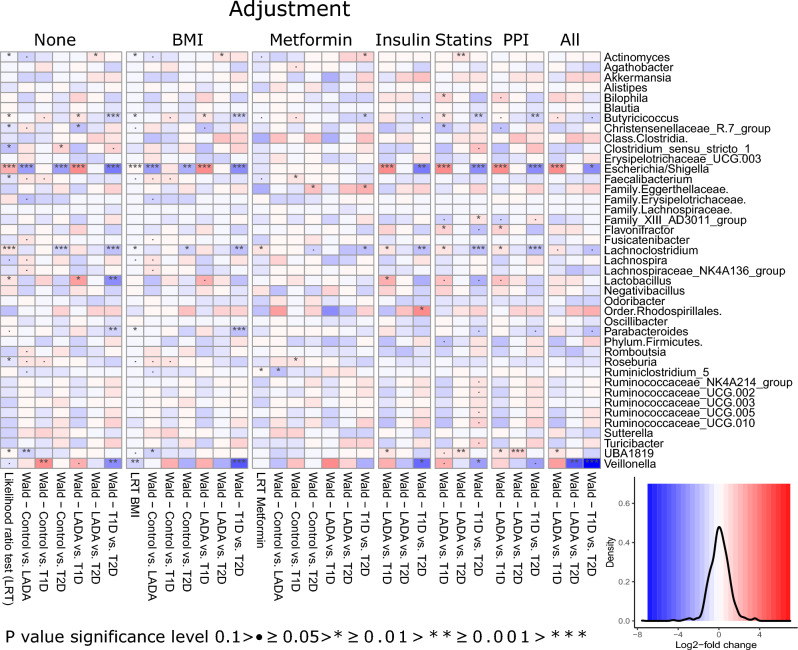
Figure 3.
Heatmap of DESeq test results comparing across all groups using the likelihood ratio test implementation (LRT) and comparing diagnostic groups pairwise using Wald test. Analysis included adjustment for BMI, use of anti-diabetic medication (insulin, statins, PPI), and all of the mentioned covariates. Adjustment for metformin was analogous to the overall analysis scheme by removing samples from individuals treated with metformin. The first specified diagnostic group is the reference for the DESeq test in the Wald test. A density plot of the effect sizes (log2fold change) is included with the same color key used in the heatmap. Genera with the lowest p-value in the LRT without adjustment were included, but Log2fold changes and p-values from all genera comparison are provided in Supplementary Table 1. The heatmap was generated with the R package pheatmap with layout adjustments performed in inkscape.

