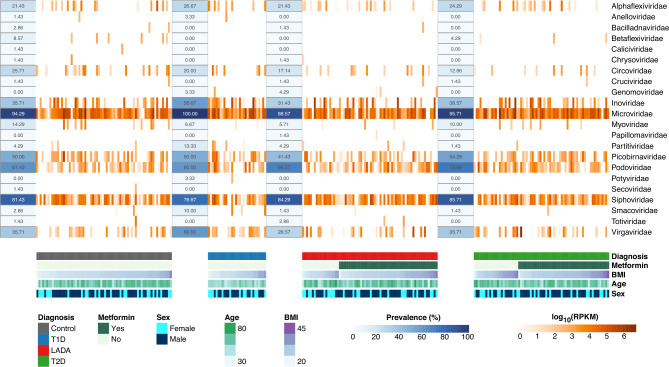
Figure 4.
Heatmap of virome abundance and prevalence. The abundance of 22 taxonomic families is represented in log10(RPKM) and grouped by diagnosis. The prevalence represents the percentage of individuals in one group where the virus could be identified. The sex and usage of metformin are observed as qualitative information, while BMI (kg/m2) and age (years) are pictured as a quantitative colormap. The heatmap was generated with the R package pheatmap with layout adjustments performed in illustrator.

