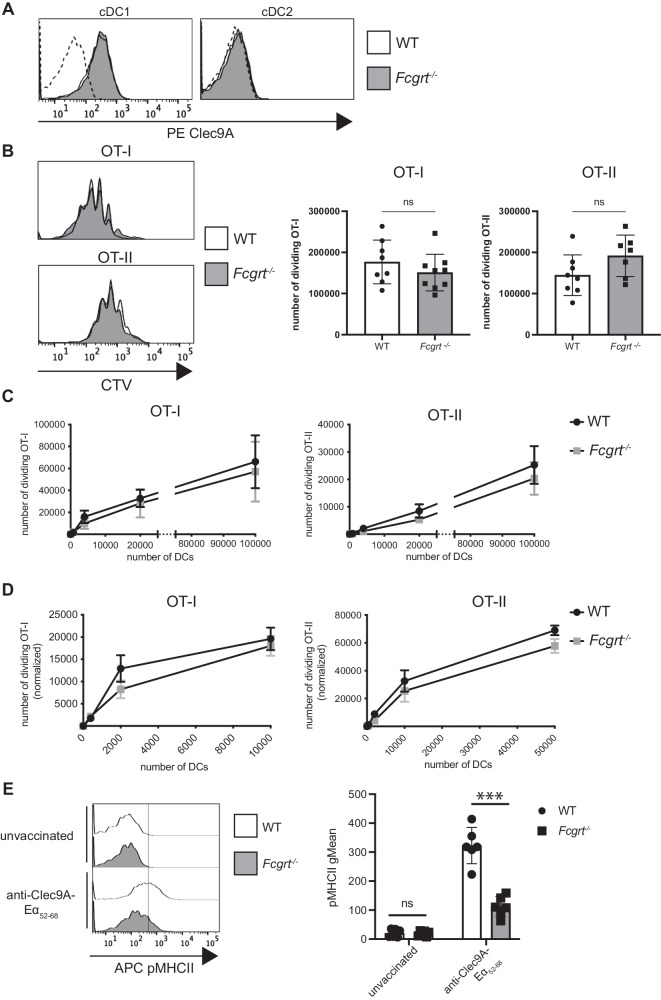
Fig. 5. FcRn does not impact MHC I and MHC II presentation following Clec9A-targeted DC vaccination.
A Flow cytometry analysis of Clec9A expression in WT and Fcgrt−/− spleen cDCs. Dashed histograms: FMO background. Data are representative of one out of three mice analyzed. B CTV-labelled OT-I and OT-II T cells and CFSE-labelled C57BL/6 mouse splenocytes were adoptively transferred into WT and Fcgrt−/− mice. One day later, mice were injected with anti-Clec9A-OVA mAb. Spleens were harvested 64 h later and analyzed by flow cytometry. CTV histograms are representative of OT-I and OT-II proliferation in each group. and the number of dividing OT-I and OT-II T cells per spleen is shown as mean ± SD. Data are pooled from two independent experiments with 3–4 mice per group. ns, not significant by unpaired Student’s t-test. C WT and Fcgrt−/− mice received anti-Clec9A-OVA mAb and 20 h later, spleens were harvested and cDC1 purified. Increasing numbers of cDC1 were co-incubated with CTV-labelled OT-I or OT-II at 37 °C for 60 h or 84 h, respectively. The number of dividing OT-I and OT-II cells was quantified by flow cytometry. Data are pooled from two independent experiments, each one done in triplicate and analysed by Mann-Whitney test with Holm-Sidak correction. D C57BL/6 mice were lethally irradiated and reconstituted with a mix of CD45.1+ BM and Fcgrt−/− (CD45.2+) BM. Mixed BM chimera mice were then treated as in (C) and the number of dividing OT-I and OT-II cells was measured. Data are pooled from three independent experiments, each one done in triplicate, and analysed by Mann-Whitney test with Holm-Sidak correction. E WT and Fcgrt−/− mice were injected with anti-Clec9A-Eα46-72 or PBS. Twenty hours later, spleens were harvested. I-Ab-Eα52-68 peptide complexes (pMHC II) at the surface of cDC1 were measured by flow cytometry. Histograms are representative of one mouse per group. Data are pooled from two independent experiments with each symbol representing an individual mouse. ***P < 0.001 by Student’s t-test. ns not significant.

