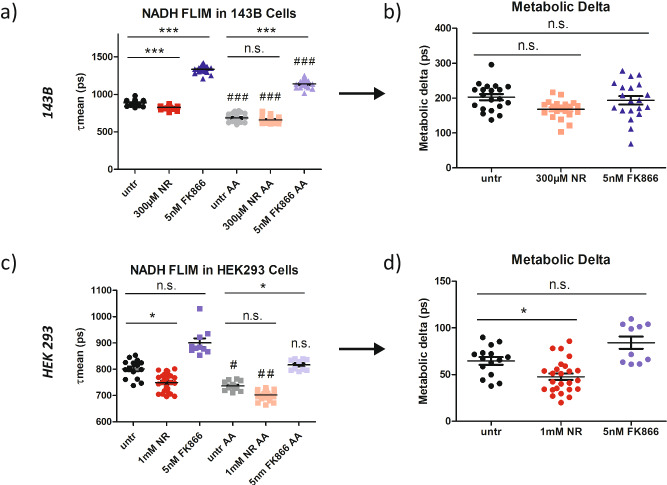
Fig. 4. Metabolic delta corrects for the impact of NAD(H) pool size in mitochondria.
a Mean NADH lifetime (τmean) of mitochondria in untreated, NR treated, and FK866 treated 143B cells before and after antimycin A (AA) treatment (1 µM) (n = 20 for all groups). b Metabolic delta of untreated, NR, and FK866 treated 143B cells calculated by subtracting individual points for mean lifetime after AA treatment from average mean lifetime before AA treatment for each treatment group (n = 20 for all groups). c Mean NADH lifetime (τmean) of mitochondria in untreated, NR treated, and FK866 treated HEK293 cells before and after antimycin A (AA) treatment (1 µM) (n = 15 for untr, n = 25 for 1 mM NR, n = 10 for 5 nM FK866). d Metabolic delta of untreated, NR, and FK866 treated HEK293 cells calculated by subtracting individual points for mean lifetime after AA treatment from average mean lifetime before AA treatment for each treatment group (n = 15 for untr, n = 25 for 1 mM NR, n = 10 for 5 nM FK866). Each data point is independent. The bars indicate the mean and standard error. Significances were calculated using ANOVA with Dunn’s post hoc test between selected groups for multiple comparisons and are indicated as n.s. for not significant, * for p < 0.05, and *** for p < 0.001.

