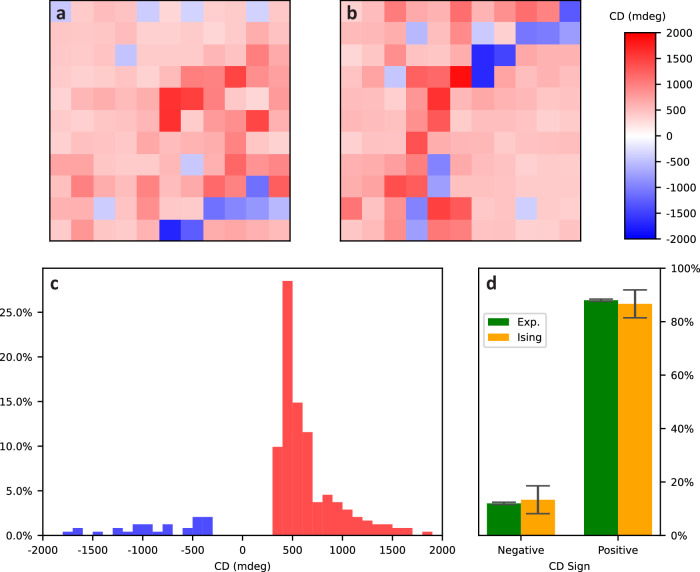
Fig. 4. Spatial distribution of CD for microcavity containing PTPO 100 nm thin films.
a, b Spatial maps of CD with step size of 0.5 mm for two non-neighboring regions of PTPO. c Histogram of CD for spatial maps depicted above (a, b). d Distribution of positive and negative CD sign and standard deviations from (c) compared with that for a Metropolis-Hastings simulation of an Ising model of two domain orientations. For the Ising model, CD sign given by averaging over 100 trajectories where the substrate affinity per domain area of one orientation is 16 eV mm−2 and the interdomain coupling per shared edge length is 10 eV mm−1 (details in SI).

