FIGURE 3.

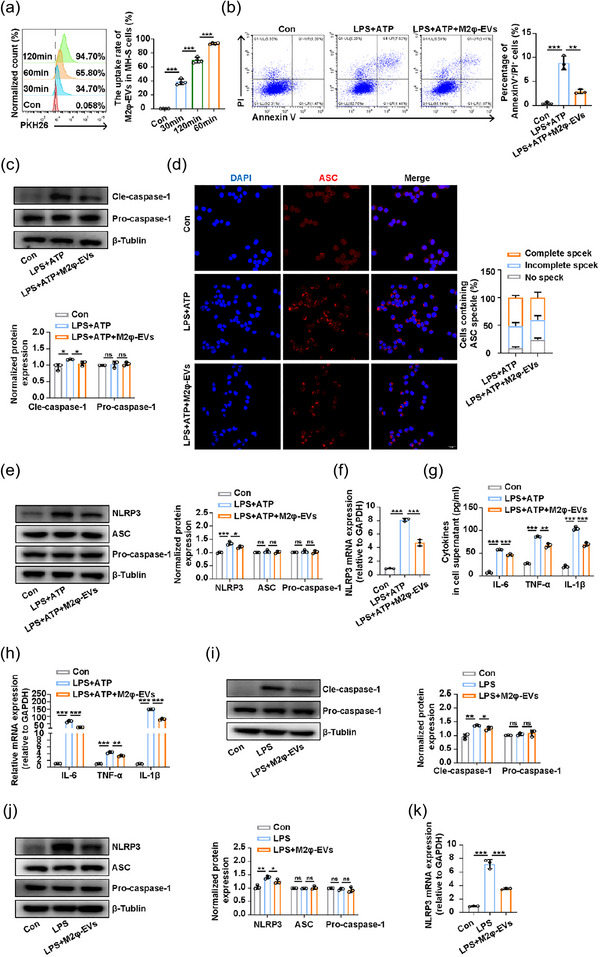
M2φ‐EV treatment suppressed the activation of the NLRP3 inflammasome. (a) The uptake rate of PKH26‐labelled M2φ‐EVs by MH‐S cells at different time points was measured by flow cytometry. (b–h) After LPS (0.5 µg/mL) stimulation for 30 min, MH‐S cells were treated with M2φ‐EVs (10 µg/mL) for 23 h and then subjected to ATP (0.5 mM) for another 30 min. (b) Flow cytometry analysis of the pyroptosis of MH‐S cells (Annexin+/PI+). (c) Western blotting analysis of Pro‐caspase‐1, Cle‐caspase‐1 levels in MH‐S cells. The histogram showed the relative ratio of the expression levels of the target protein to that of an internal reference. (d) The ASC speck formation was visualised by immunofluorescence analysis in MH‐S cells. The histogram represented the quantification of the number of ASC specks. (e) Western blotting analysis of NLRP3, ASC and Pro‐caspase‐1 levels in MH‐S cells. The histogram showed the relative ratio of the expression levels of the target protein to that of an internal reference. (f) The mRNA expression of NLRP3 in MH‐S cells was analysed by qPCR. (g) The concentrations of IL‐6, TNF‐α and IL‐1β in cell supernatant were measured by ELISA. (h) The mRNA expressions of IL‐6, TNF‐α and IL‐1β in MH‐S cells were analysed by qPCR. (i–k) C57BL/6 mice were pretreated with LPS at a dosage of 1 mg/kg intratracheally for 30 min and then injected intratracheally with 100 µg M2φ‐EVs, and mice were sacrificed at 24 h after LPS administration for further experimental analysis. (i) Western blotting analysis of Pro‐caspase‐1, Cle‐caspase‐1 levels in lung tissues. The histogram showed the relative ratio of the expression levels of the target protein to that of an internal reference. (j) Western blotting analysis of NLRP3, ASC and Pro‐caspase‐1 levels in lung tissues. The histogram showed the relative ratio of the expression levels of the target protein to that of an internal reference. (k) The mRNA expression of NLRP3 in lung tissues was analysed by qPCR. Representative results from three independent experiments are shown (n = 3). Scale bar, 20 µm. ns, not significant, *p < 0.05, **p < 0.01, ***p < 0.001 (one‐way ANOVA test; mean ± SD).
