FIGURE 6.

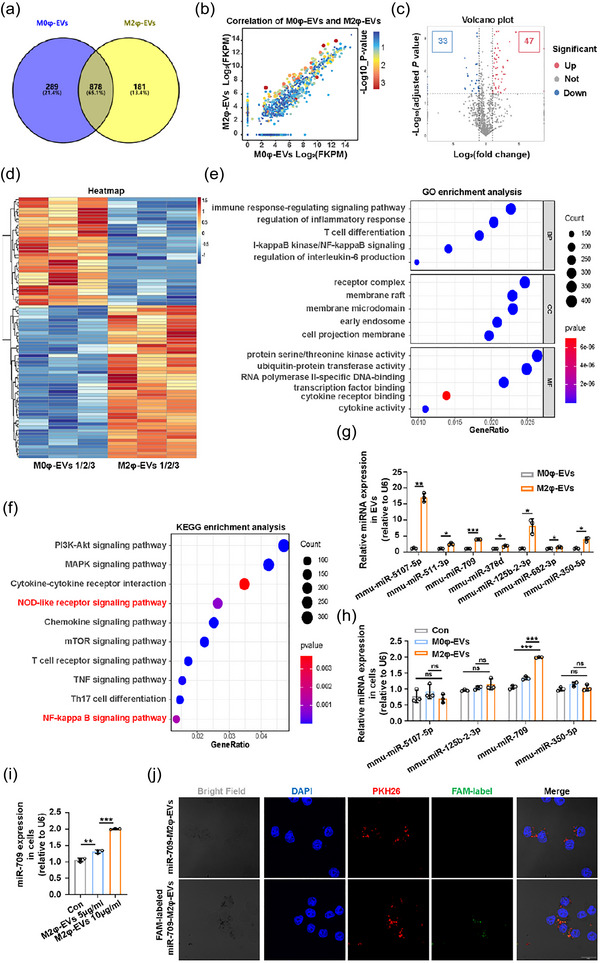
The identification of potentially effective candidate miRNAs in M2φ‐EVs. (a) The Venn diagram of the shared and differential miRNAs in M0φ‐EVs and M2φ‐EVs. (b) The scatter plot of all expressed miRNAs in M0φ‐EVs and M2φ‐EVs. (c) The volcano map of all expressed miRNAs in M0φ‐EVs and M2φ‐EVs. (b) The heatmap of the 80 DE‐miRNAs in M0φ‐EVs and M2φ‐EVs. (e) The GO enrichment analysis of the target genes of the 47 upregulated DE‐miRNAs. (f) The KEGG enrichment analysis of the target genes of the 47 upregulated DE‐miRNAs. (g) qPCR detection of the expressions of the selected 7 miRNAs in M0φ‐EVs and M2φ‐EVs. (h) qPCR detection of the expressions of the selected 4 miRNAs in MH‐S cells co‐cultured with PBS, M0φ‐EVs or M2φ‐EVs, respectively, for 24 h. (i) qPCR detection of the expression of miR‐709 in MH‐S cells co‐cultured with different concentrations of M2φ‐EVs for 24 h. (j) The uptake of the FAM‐labelled miR‐709‐M2φ‐EVs or miR‐709‐M2φ‐EVs was visualised by immunofluorescence analysis in MH‐S cells after incubation for 24 h. Representative results from three independent experiments are shown (n = 3). Scale bar, 20 µm. ns, not significant, *p < 0.05, **p < 0.01, ***p < 0.001 (unpaired Student t‐test in G; one‐way ANOVA test in h, i; mean ± SD).
