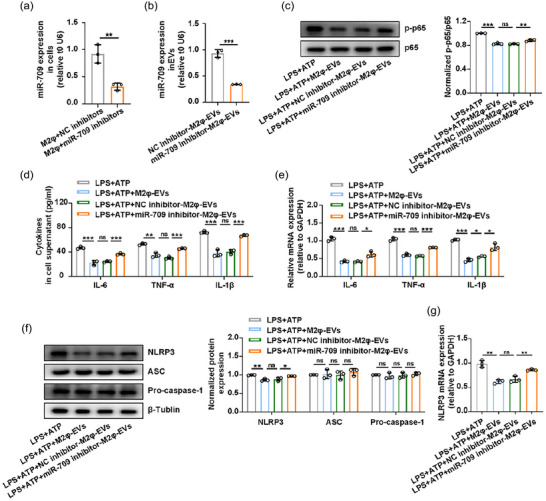
FIGURE 7.

M2φ‐EVs exerted the anti‐inflammatory effect through miR‐709 in vitro. (a and b) The MH‐S cells were stimulated with IL‐4 for 24 h and then transfected with NC inhibitors or miR‐709 inhibitors for another 24 h. The expression of miR‐709 was detected by qPCR in MH‐S cells (a) or in NC inhibitor‐M2φ‐EVs and miR‐709 inhibitor‐M2φ‐EVs (B). (c–g) MH‐S cells were stimulated with LPS (0.5 µg/mL) for 30 min and then incubated with M2φ‐EVs, NC inhibitor‐M2φ‐EVs or miR‐709 inhibitor‐M2φ‐EVs for 23 h, and then subjected to ATP (0.5 mM) for another 30 min. (c) Western blotting analysis of p65 and p‐p65 levels in MH‐S cells. The histogram showed the relative ratio of the expression levels of the target protein to that of an internal reference. (d) The concentrations of IL‐6, TNF‐α and IL‐1β in cell supernatant were measured by ELISA. (e) The mRNA expressions of IL‐6, TNF‐α and IL‐1β in MH‐S cells were analysed by qPCR. (f) Western blotting analysis of NLRP3, ASC and Pro‐caspase‐1 levels in MH‐S cells. The histogram showed the relative ratio of the expression levels of the target protein to that of an internal reference. (g) The mRNA expression of NLRP3 in MH‐S cells was analysed by qPCR. Representative results from three independent experiments are shown (n = 3). ns, not significant, *p < 0.05, **p < 0.01, ***p < 0.001 (one‐way ANOVA test excepted for unpaired Student t‐test in a, b; mean ± SD).
