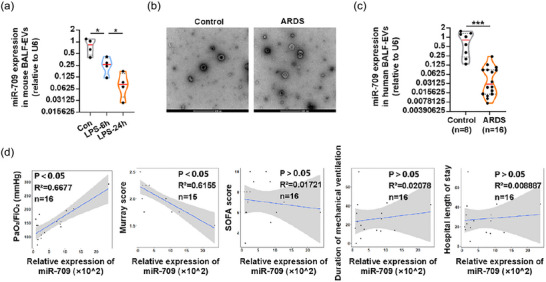
FIGURE 9.

miR‐709 expression in BALF‐EVs was correlated with the severity of ALI/ARDS. (a) The relative expression of miR‐709 in BALF‐EVs of mice at different time points after LPS administration was detected by qPCR. (b) Representative TEM images of BALF‐EVs of control and ARDS patients. (c) The expression of miR‐709 in BALF‐EVs of control and ARDS patients was detected by qPCR. (d) The correlation between the levels of miR‐709 in BALF‐EVs of ARDS patients with their PaO2/FiO2, Murray score, SOFA score, duration of mechanical ventilation, and hospital length of stay. Representative results from three independent experiments are shown (n = 4 in a). Scale bar, 200 nm. *p < 0.05, ***p < 0.001 (one‐way ANOVA test in a; unpaired Student t‐test in c; Spearman rank‐order correlation test in d; mean ± SD).
