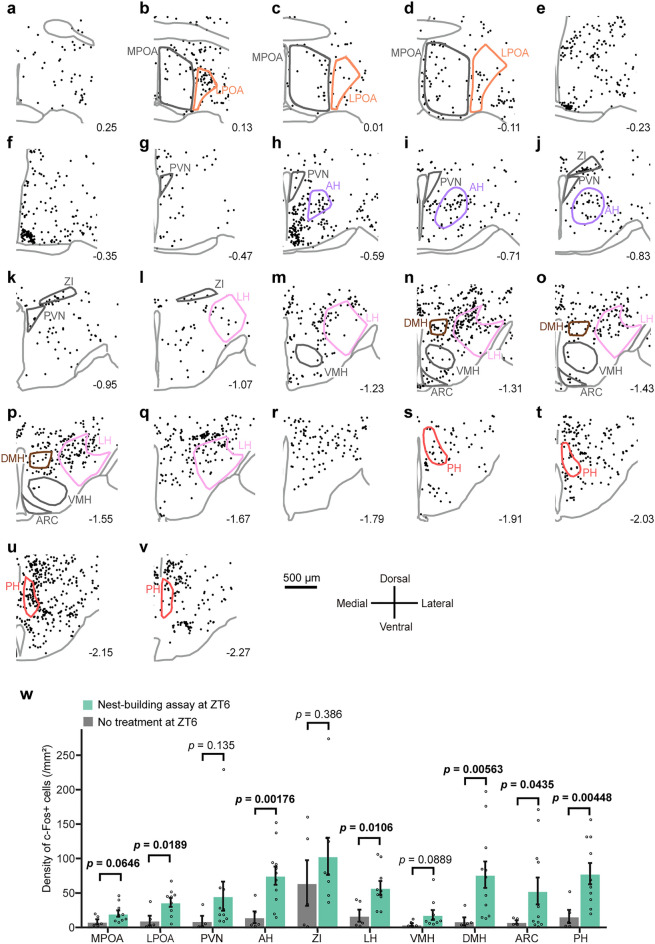
Figure 2.
Nest-building activated multiple hypothalamic regions in males. (a–v) Coronal brain sections show the distribution of c-Fos-immunoreactive cells induced by nest-building in the hypothalamus. Each dot indicates a c-Fos-immunoreactive cell. The digit indicates the distance from the bregma. Scale bar 500 μm. Enclosed areas were assessed for the density of c-Fos + cells for (w). (w) Density of c-Fos-immunoreactive cells of nest-building assay at ZT6 (MPOA, n = 9; LPOA, n = 9; PVN, n = 10; AH, n = 11; ZI, n = 8; LH, n = 9; VMH, n = 9; DMH, n = 11; ARC, n = 11; PH, n = 10) and of ad libitum at ZT6 (MPOA, n = 5; LPOA, n = 5; PVN, n = 4; AH, n = 5; ZI, n = 5; LH, n = 5; VMH, n = 5; DMH, n = 5; ARC, n = 4; PH, n = 5). Welch’s t-test. Data are shown as the mean ± s.e.m.

