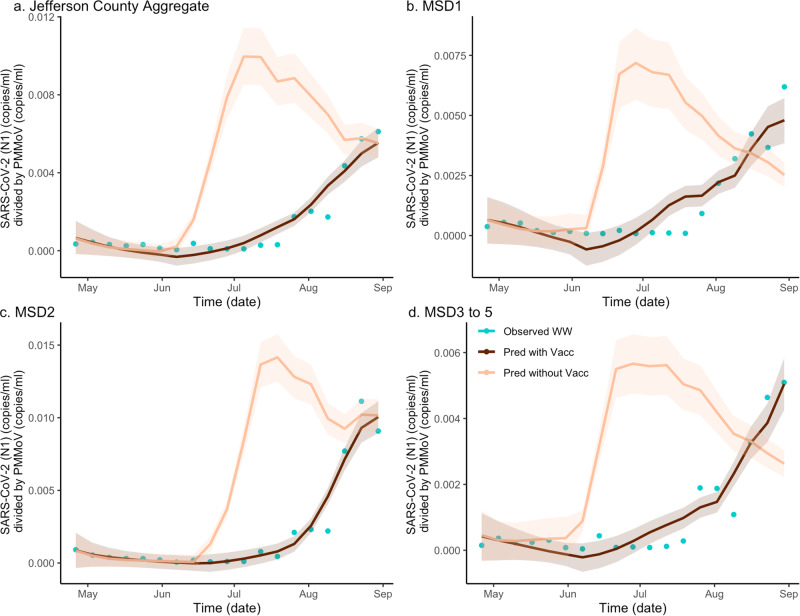
Fig. 2. The estimated effect of vaccination on SARS-CoV-2 (N1) wastewater concentration normalized by pepper mild mottle virus in sewersheds of Jefferson County, KY (USA).
The dark brown line is the regression-based fit to the wastewater concentration data and the light brown line is the prediction of wastewater concentration using synthetic prevalence from model with vaccination effect zeroed out. The shaded areas represent 95% credible intervals. The blue dots are observed weekly average wastewater concentrations. The panels compare the vaccination effect on wastewater concentration for Jefferson County (a) as well as stratified by sewershed (b–d).

