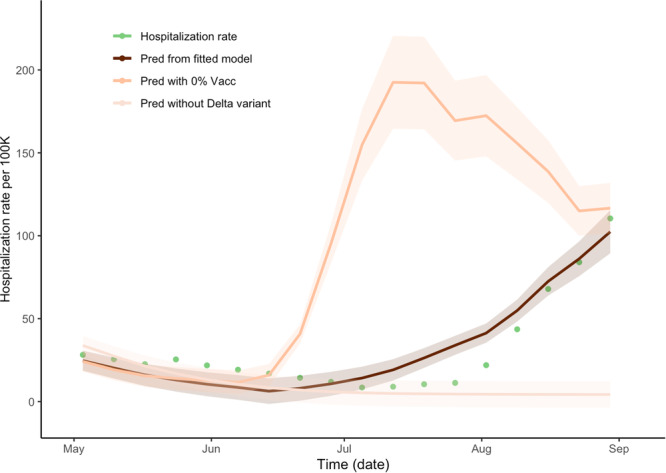
Fig. 5. Time lag-dependent analysis of the relationship between hospitalization rate and wastewater concentration, Jefferson County, KY (USA).

Predictions and 95% confidence intervals of hospitalization rate regressed on week-lagged variables of the weekly average of wastewater concentration according to the changes of the vaccination proportion of the community. The dark line represents the prediction using the observed wastewater concentrations with 64% of community vaccination. The lighter line represents the prediction using the wastewater concentrations obtained from the model under zero community vaccination. The lightest line represents the prediction under the counterfactual modified model with the Delta-infected model compartment zeroed-out (no Delta variant present). The green dots represent the weekly average of the observed hospitalization rate. The ratios of the areas between the prediction from the fitted model and of no vaccination are 0.318, and in the absence of the Delta variant is 3.037, respectively.
