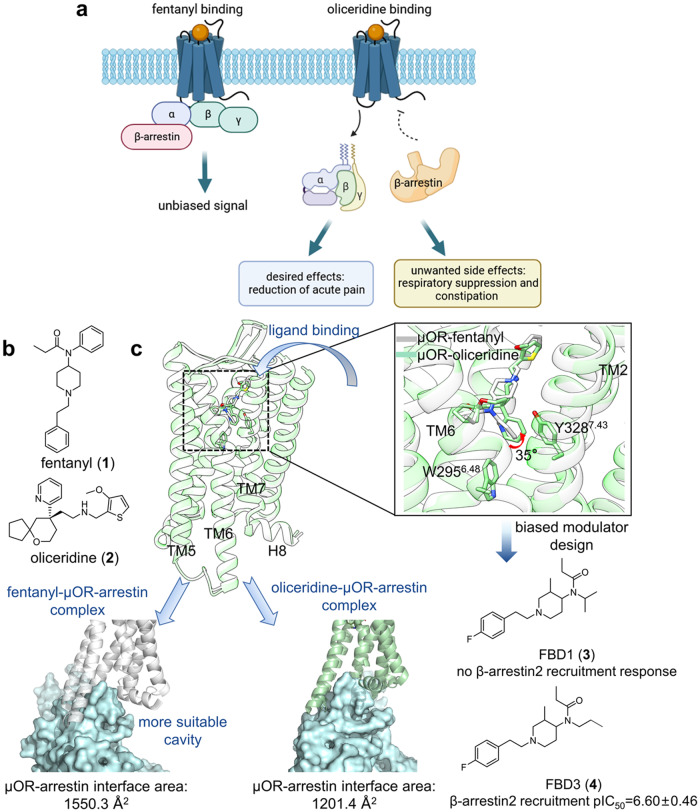
Fig. 5.
a A bridged general view of fentanyl and oliceridine inducing distinct pharmacological profiles. b 2D structure of fentanyl and oliceridine shown for clarity. c Superimposed views of μOR–fentanyl (gray cartoon, gray sticks; PDB: 8EF5) and μOR–oliceridine (light green cartoon, light green sticks; PDB: 8EFB) complex structure, together with the comparison of ligand binding modes and arrestin coupling interfaces, are presented. 2D structures of two designed biased modulators are also presented

