Fig. 6.
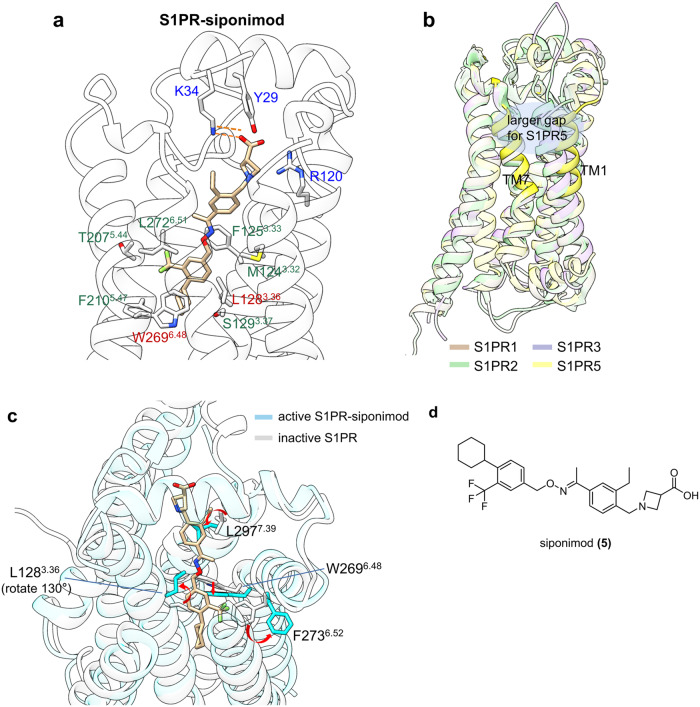
a Detailed binding modes of S1PR5 in complex with siponimod. Labels of the residues engaged in polar contacts with siponimod are colored in blue, with hydrogen bonds presented by orange dashes. The residues of the hydrophobic pocket that stabilizes ligand binding are marked with green labels, while residues that are critical for signal transduction are labeled in red. b Superimposed views of S1PR1 (orange cartoon, PDB: 7T6B), S1PR2 (light green cartoon, PDB: 7C4S), S1PR3 (light purple cartoon, PDB: 7YXA), and S1PR5 (yellow cartoon, PDB: 7TD4) GPCR structures, where TM1 and TM7 of S1PR5 are highlighted for clarity. c Superimposed views of active S1PR1-siponimod complex (cyan cartoon, cyan stick, PDB: 7TD4) and inactive S1PR1 structure (gray cartoon, gray stick, PDB: 3V2Y) to illustrate the “toggle switch” activation mechanism. d 2D structure of siponimod is shown for clarity

