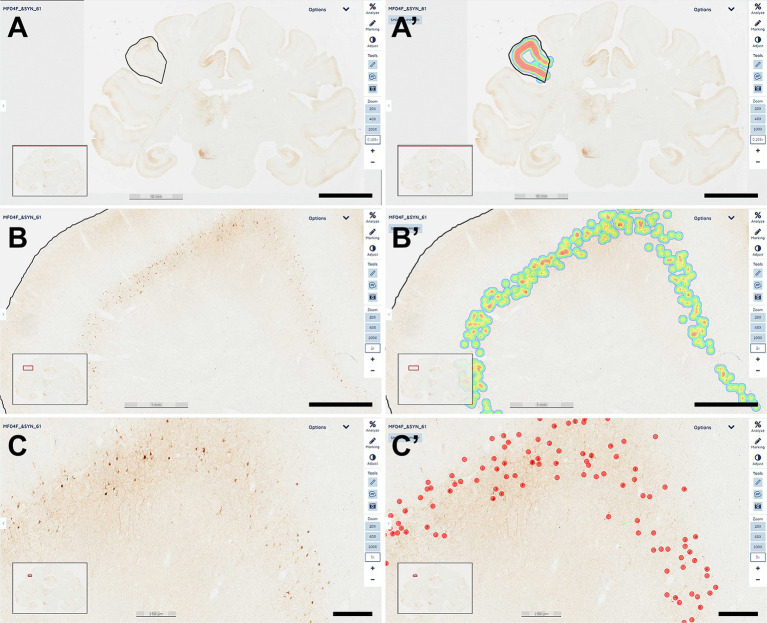
Figure 1.
Quantification of α-Syn + neurons. A dedicated deep-learning algorithm identifying α-Syn transduced neurons was prepared with Aiforia® (www.aiforia.com). Scanned sections were uploaded to Aiforia® cloud and several different ROIs were outlined throughout cortical and subcortical territories. (A) Illustrates the delineation of the left supramarginal gyrus at low magnification (0.169×). Labeling intensity, reflecting the number of transduced neurons is represented color-coded in (A’). (B) Shows the same area at a magnification of 2×, together with the accompanying result, color-coded as illustrated in (B’). A higher-magnification view (5×) of the obtained labeling is shown in (C), together with the accurate identification of every single α-Syn + neuron, as observed in (C’). All transduced neurons were quantified within the selected ROI. Illustrated images are taken from animal MF04 and correspond to coronal section #61. In summary, all α-Syn + neurons were counted, and indeed the algorithm was fully accurate and specific (a total of 414 neurons were identified in this ROI). Scale bars are 10 mm for (A,A’); 1 mm in (B,B’) and 250 μm in (C,C’).

