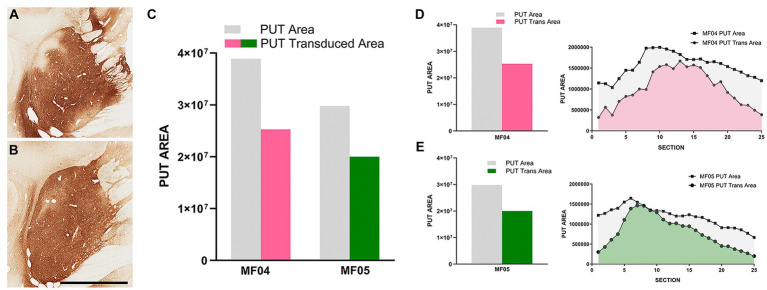
Figure 2.
Injection sites and transduced putaminal areas. (A,B) Illustrate the intraparenchymal deliveries of AAV9-SynA53T in the putamen at the level of ac = 0 mm [animal MF04 is represented in (A); animal MF05 is illustrated in (B)]. The extent of the putaminal transduced area is shown in the histogram of (C). The area of the left putamen is represented as gray bars, whereas the extent of transduced areas are illustrated as either purple (animal MF04) or green bars (animal MF05). (D,E) Represent the rostrocaudal extent of the transduced area (purple for animal MF04 and green for animal MF04) against the rostrocaudal extent of the putamen (gray). Upon the delivery of AAV9-SynA53T into the putamen (3 sites; 25 μL each), obtained transduced areas accounted for 64.97 and 67.18% (animals MF04 and MF05, respectively) of the total putaminal area. Viral vector expression was largely restricted within putaminal boundaries, with minimal spread towards neighboring white matter tracts surrounding the putamen. Furthermore, a complete lack of viral spread through the injection tracts can easily be observed in (A,B) (scale bar = 7.0 mm).

