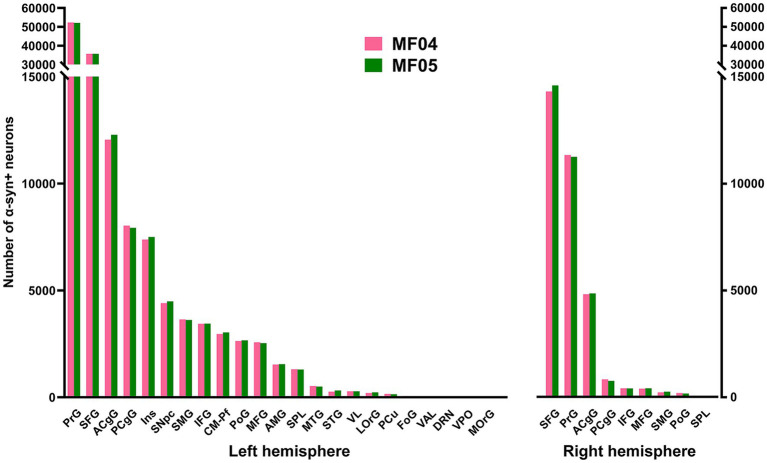
Figure 3.
Number of α-Syn + neurons across pre-defined ROIs. Histograms showing the total number of quantified α-Syn + neurons within each selected ROI in the left and right hemispheres. Both animals showed very similar numbers of transduced neurons within each territory. The prefrontal and superior frontal gyri are by large the main contributors to corticostriatal projections (left and right hemispheres), followed by the cingulate gyri (anterior and posterior; both hemispheres), as well as the insular gyrus (left hemisphere only). At the subcortical level, the caudal intralaminar nuclei and the substantia nigra pars compacta of the left hemisphere are the areas containing the higher number of a-Syn + neurons. Abbreviations (from left to right in histograms): precentral gyrus (PrG), superior frontal gyrus (SFG), anterior cingulate gyrus (ACgG), posterior cingulate gyrus (PCgG), insular gyrus (Ins), substantia nigra pars compacta (SNpc), supramarginal gyrus (SMG), inferior frontal gyrus (IFG), centromedian-parafascicular thalamic complex (CM-Pf), postcentral gyrus (PoG), middle frontal gyrus (MFG), amygdaloid complex (AMG), superior parietal lobule (SPL), middle temporal gyrus (MTG), superior temporal gyrus (STG), ventral lateral thalamic nucleus (VL), lateral orbital gyrus (LOrG), precuneus (PCu), fronto-orbital gyrus (FoG), ventral anterior thalamic nucleus (VAL), dorsal raphe nucleus (DRN), ventral posterior thalamic nucleus (VPO), and medial orbital gyrus (MOrG).

