Figure 8.
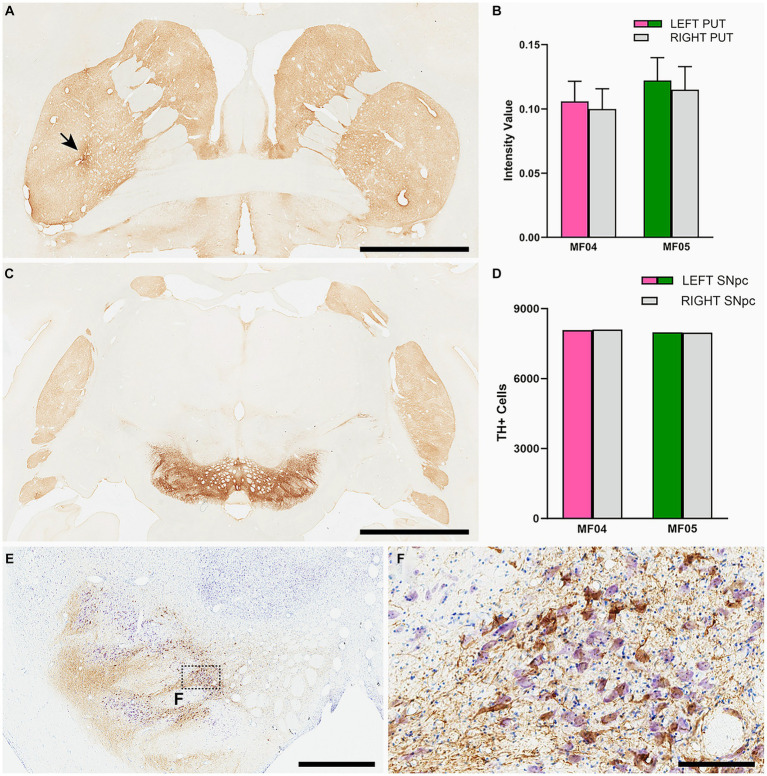
Nigrostriatal system: Photomicrographs and histograms illustrating the conducted analyses at the level of the nigrostriatal system. The optical density of TH+ terminals was compared between the left and right putamen across 26 equally-spaced sections. (A) Shows a coronal section immunostained for TH at the level of the midline decussation of the anterior commissure (animal MF05). Arrow in (A) indicates the injection site of AAV9-SynA53T. (B) Is a histogram showing obtained quantifications for optical densities in both animals. The right hemisphere is represented by a gray bar, whereas purple and green bars represent the left putamen (animals MF04 and MF05, respectively). Optical densities of TH+ terminals were similar when comparing the left and right putamen nuclei in both animals. (C) Is a low-power photomicrograph taken from a coronal section through the substantia nigra in animal MF05, immunostained for TH. As indicated in the histogram shown in (D), the number of TH+ neurons remain the same when comparing left vs. right substantia nigra [color-coded the same was as in (B)]. Panel (E) and inset (F) illustrates the immunoperoxidase detection of α-Syn counterstained with toluidine blue (Nissl stain) in a coronal section through the substantia nigra in animal MF04. Although roughly half of the dopaminergic neurons became transduced with α-Syn (54.94% in MF04 and 56.26% in animal MF05), any evident sign of nigrostriatal damage was observed. Scale bar is 6.5 mm in (A), 3.5 mm in (B), 1,750 μm in (E) and 175 μm in (F).

