Figure 1.
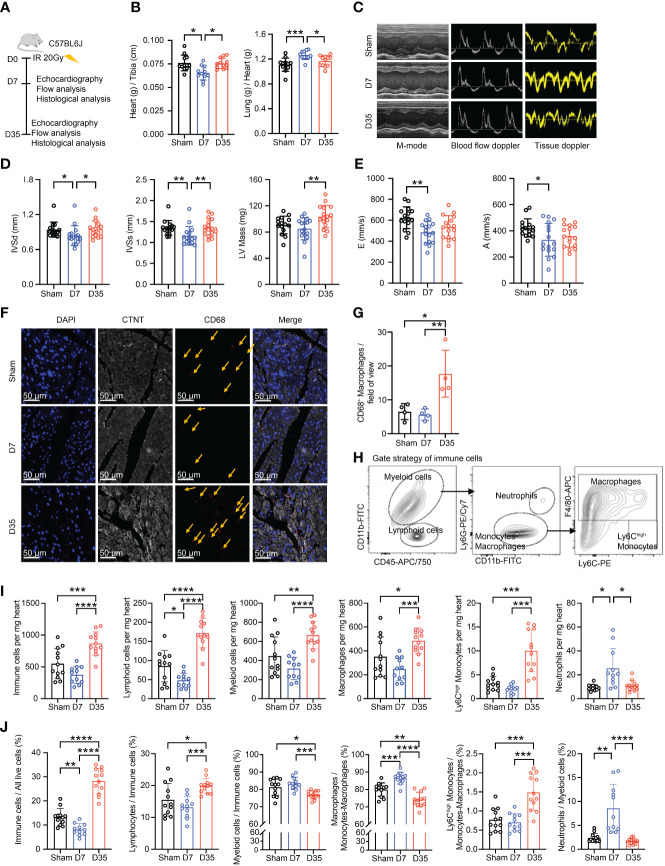
Transient changes in cardiac function are accompanied by changes in the number of cardiac macrophages. (A) Schematic diagram of animal modeling and experimental procedures. (B) Comparisons on Heart (g) to Tibia (cm) ratioa and Lung (g) to Heart (g) ratiob (Sham, n=12; D7, n=11; D35, n=12). Data were pooled from three independent experiments. (C) Representative images of echocardiography in cardiac function. M-mode, blood flow doppler and tissue doppler images views. (Sham, n=15; D7, n=16; D35, n=16). Data were pooled from three independent experiments. (D) Echocardiographic analysis of systolic function by M-mode: interventricular septum in diastole (IVSdb), interventricular septum in systole (IVSsb) and left ventricular (LV) Mass (corrected)a. (E) Echocardiographic analysis of diastolic function by blood flow doppler and tissue doppler: the speed E peaka (left ventricular early-diastolic fast filling) and the speed A peaka (left ventricular late-diastolic filling). (F) Representative images of immunofluorescent staining: CD68+ macrophages (Red), CTNT+ cardiomyocytes (Gray), DAPI+ nucleus (Blue). The yellow arrows point to macrophages. Scale bar, 50 μm. (n=4 in each group). (G) The statistical plota of panel (F). (H) Flow cytometry gating scheme used to identify cardiac immune cells. (I) Comparison on number of immune cells in per mg heart tissue by flow analysis. Ly6Chigh Monocytesc; Neutrophilsc; the other cell typesa. (J) Comparison on percentage of each cell type by flow analysis. Immune cells/All live cells (%)c; Ly6Chigh Monocytes/Myeloid cells (%)c; Neutrophils/Myeloid cells (%)b; the other parametersa. Results of (I, J) were from three independent flow analyses. (Sham: n=12; D7: n=11; D35: n=12). “a”: Ordinary one-way ANOVA test; “b”: Kruskal-Wallis test; “c”: Welch ANOVA test. * P<0.05, ** P<0.01, *** P<0.001 and **** P<0.0001.

