Figure 2.
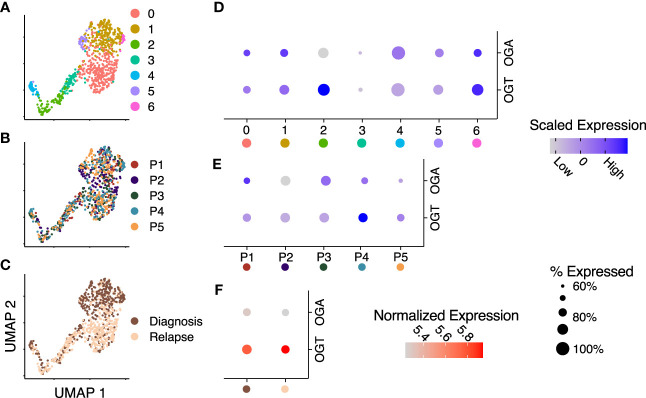
OGT expression is increased across several RNA-sequencing datasets. (A–C) Integrated UMAP embeddings of clusters (A), patients (B) and timepoints (C). (D, E) Dot plot with scaled average expression of OGA and OGT per cluster (D) and patient (E). (F) Dot plot with log-normalized expression of OGA and OGT per timepoint. (D–F) Size of dots represents the percentage of cells with more than one UMI count for OGT or OGA, respectively. Data is from Stetson LC, et al (11). Data includes 721 cells from 5 patients.

