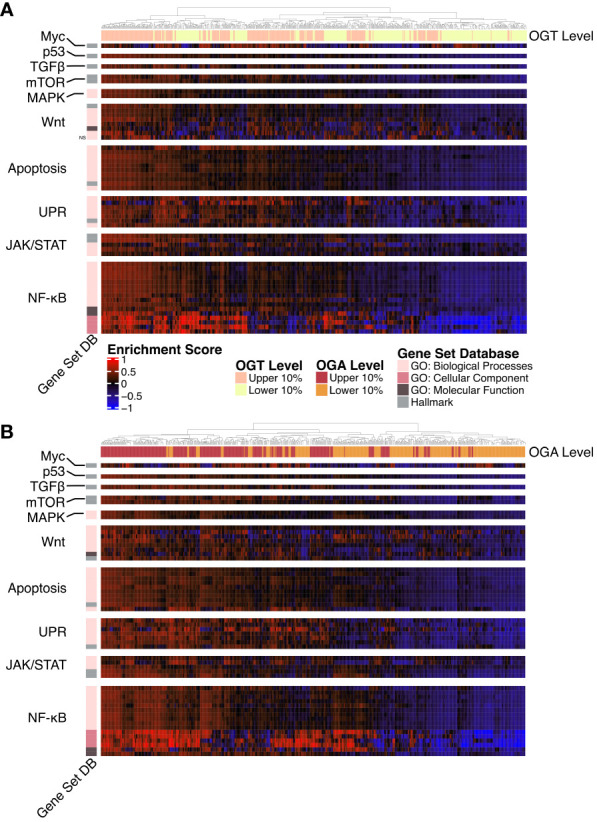
Figure 4.

Gene Ontology and Hallmark GSVA. Heatmap of the GSVA enrichment score per sample from AML samples. All gene sets pass a p-value threshold of 0.05 unless otherwise noted with NS based on a DE analysis. Gene sets were manually annotated with a category. n = 636. (A) Upper and lower 10% of samples by OGT expression. (B) Upper and lower 10% of samples by OGA expression.
