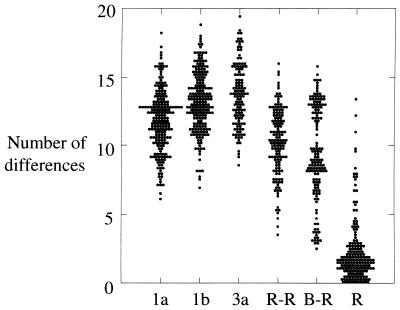
FIG. 3.
Scatter plot of the number of amino acid differences between different groups of HVR sequences. The number of amino acid substitutions in the HVR (positions 383 to 408) was calculated for sequences of viruses of genotypes 1a (n = 58), 1b (n = 46) or 3a (n = 16), among representative sequences from different anti-D recipients (R-R), between these sequences and the consensus sequence of the infectious source (B-R), and within individual anti-D recipients (R).

