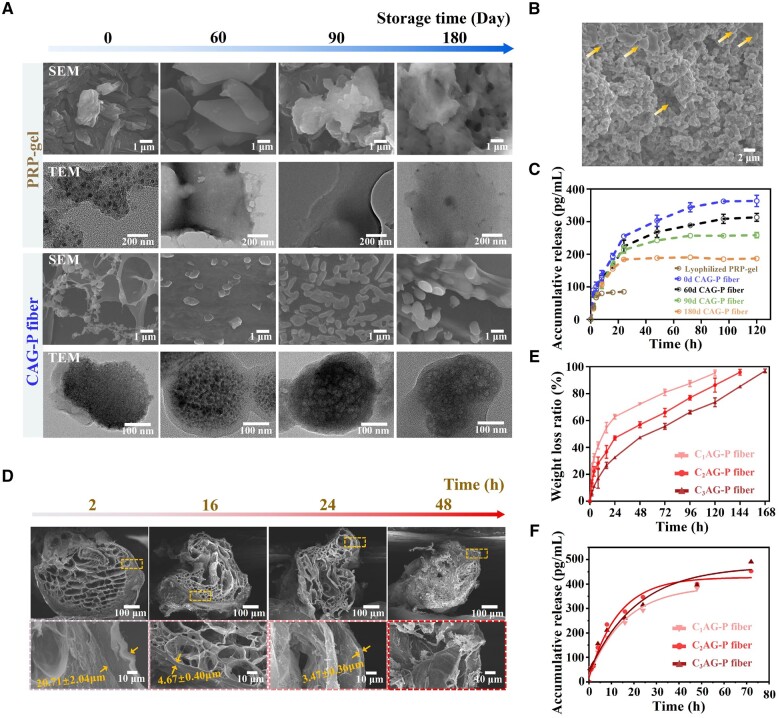
Figure 3.
Microstructure and degradation performance of CAG-P fibers. (A) SEM and TEM images of PRP loaded in the freeze-dried PRP-gel and CAG-P fibers following 0, 60, 90 and 180 days of storage at −20°C. (B) Morphology of PRP after rehydration within the fibers following 180 days of storage (arrows indicate non-activated PRP). (C) Release of VEGF from freeze-dried PRP-gel and CAG-P fibers after 0, 60, 90 and 180 days of storage. (D) SEM images of CAG-P fibers after degradation in PBS for 2, 16, 24 and 48 h. (E) Degradation performance and (F) VEGF release performance of CAG-P fibers prepared with different outer layer flow rates (C1, C2 and C3 represent outer layer CS solution flow rates of 50 ml/h, 100 ml/h and 150 ml/h, respectively, and the release data were fitted by first-order kinetic model).

