Figure 5.
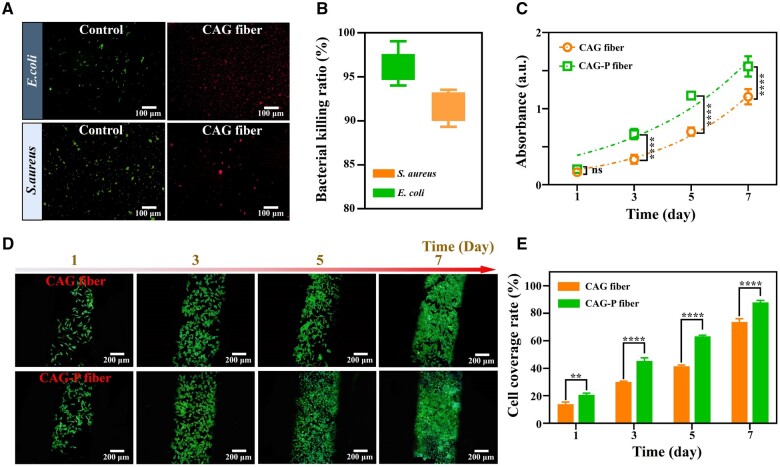
In vitro antibacterial performance and biocompatibility of CAG-P fibers. (A) Live/dead staining images of bacteria after 24 h of incubation in CAG fiber and (B) bactericidal rate. (C) Cell proliferation of L929 cells on CAG fiber and CAG-P fiber on days 1, 3, 5 and 7. (D) Coverage of L929 cells on CAG fiber and CAG-P fiber and (E) cell coverage rate. (*P < 0.05, **P < 0.01, *** P < 0.001, **** P < 0.0001).

