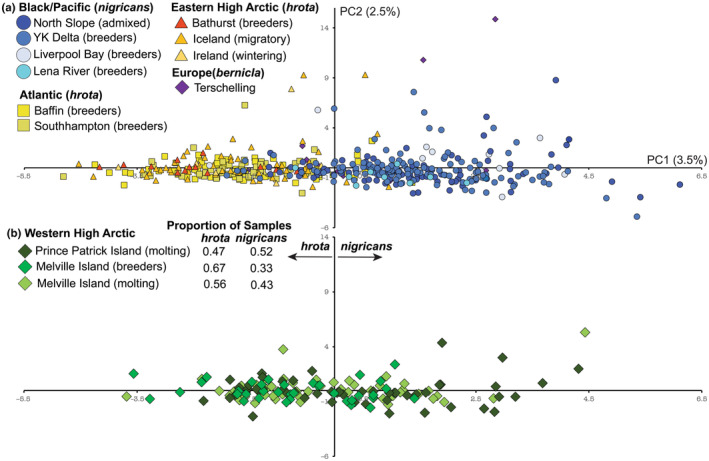
FIGURE 4.

PCA plot of first two principal components based on 12 microsatellite loci. For illustrative purposes, Western High Arctic samples were not shown in the (a) top panel but are shown in (b) bottom panel. Both panels represent the same analysis. Although there is some overlap, the x‐axis divides the majority of nigricans‐like (Pacific/Black) and hrota‐like (Atlantic/EHA) genotypes. The table in the bottom panel reports the proportion of samples from the Western High Arctic on either side of the y‐axis (positive or negative PC1 coordinate value).
