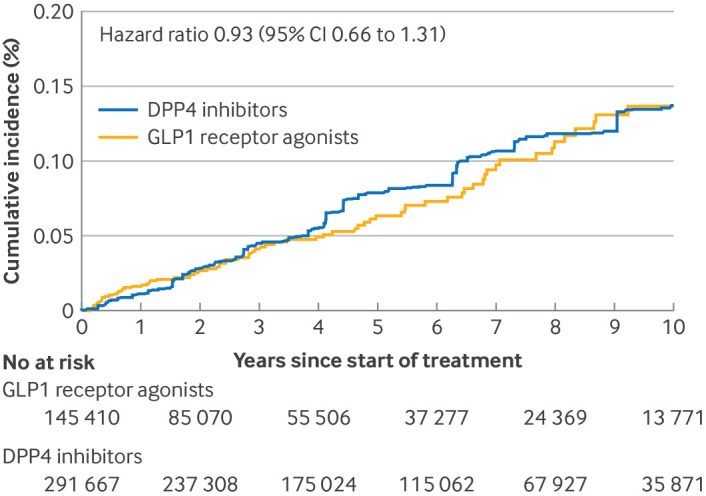
Fig 2.

Cumulative incidence of thyroid cancer. The cumulative incidence curve and hazard ratio were adjusted for all variables shown in table 1 using propensity score fine stratification weighting. The cumulative incidence curve was truncated at 10 years because of decreasing numbers of participants and outcome events; maximum follow-up was 14.6 years. CI=95% confidence interval; DPP4=dipeptidyl peptidase 4; GLP1=glucagon-like peptide 1
