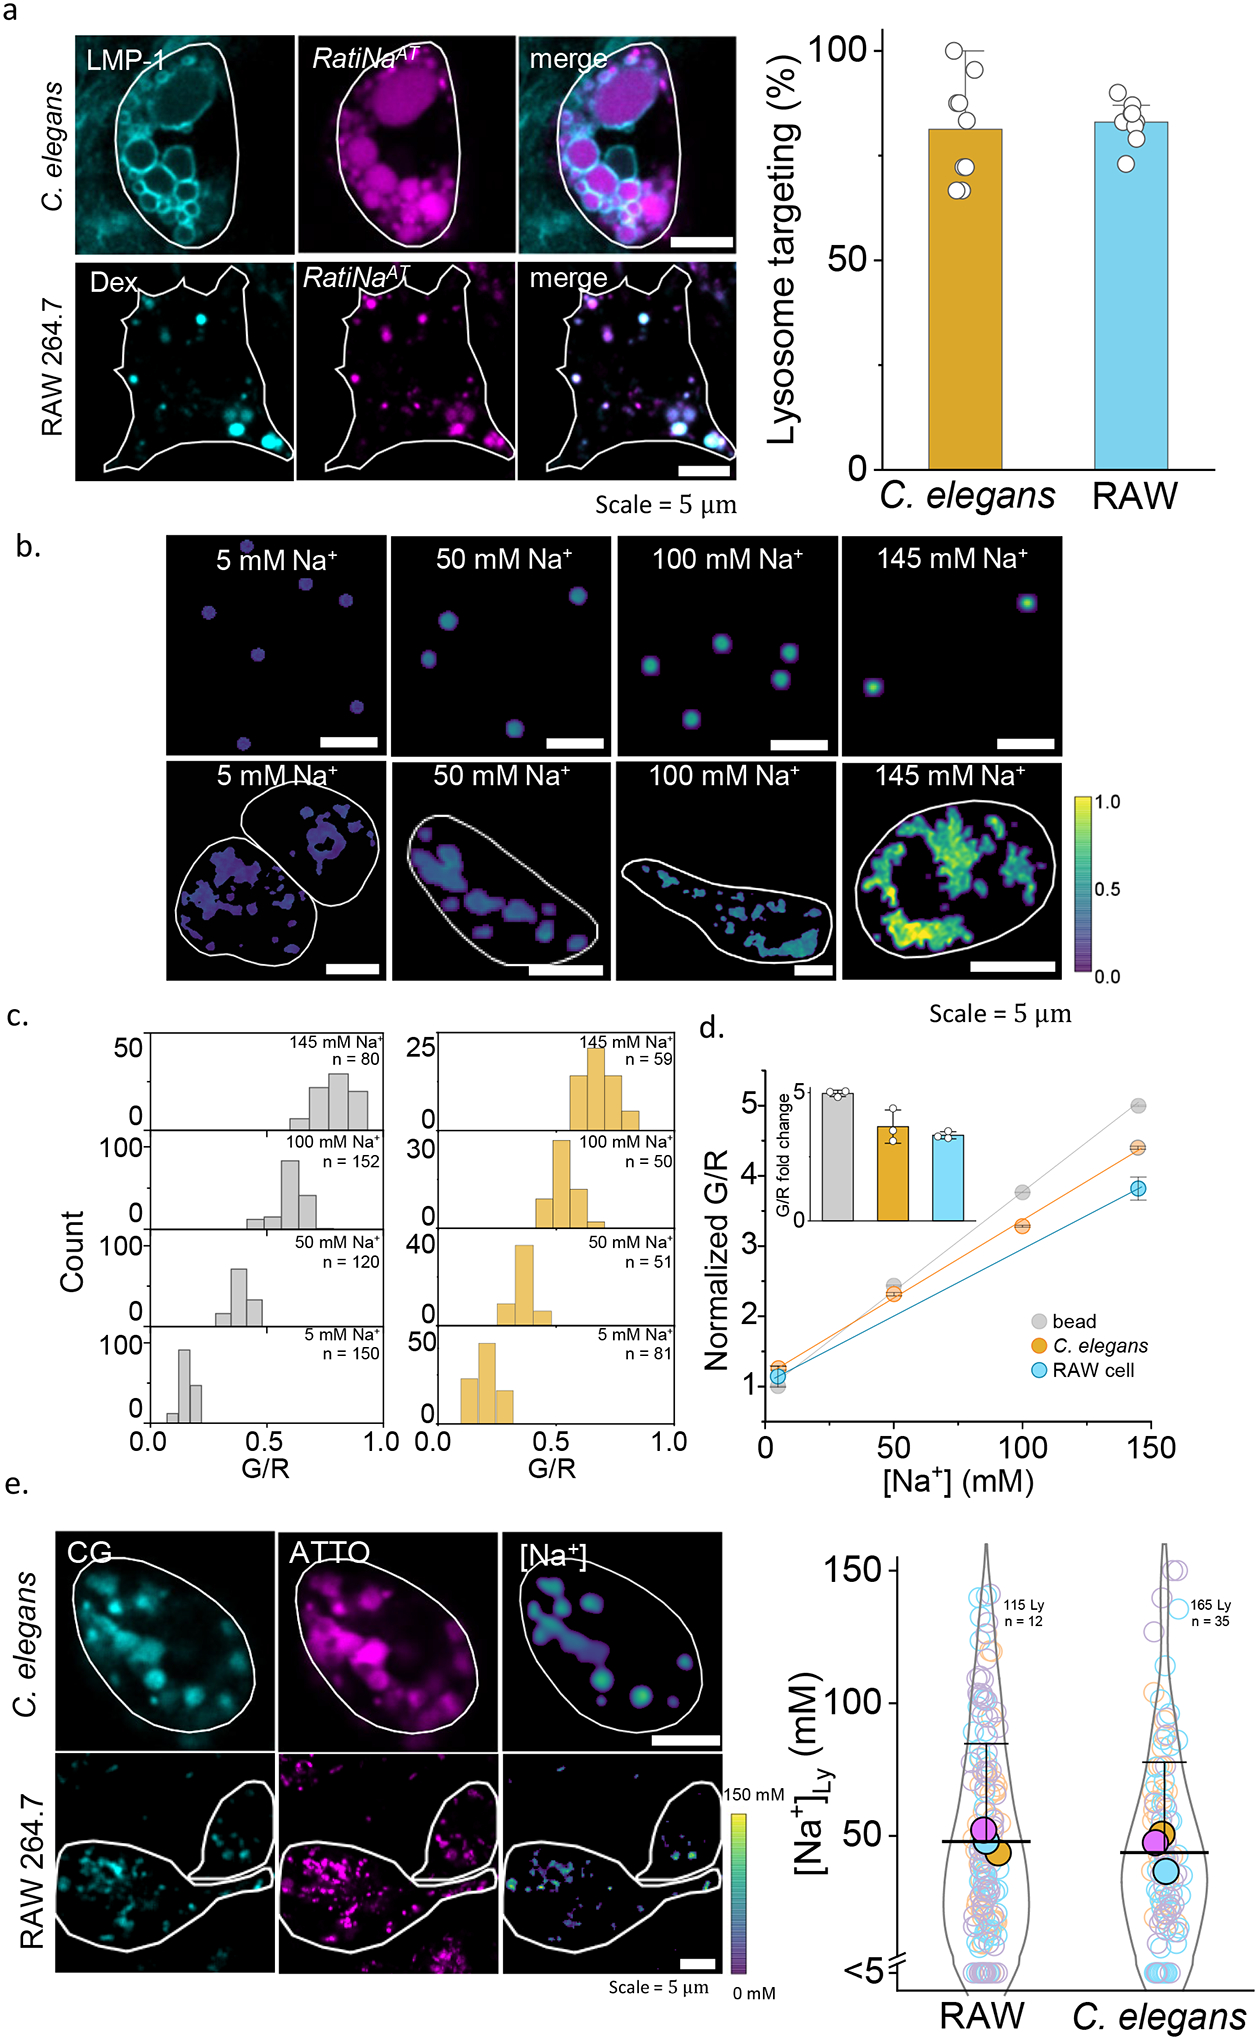
Figure 2 |. In cell and in vivo calibration of RatiNa to measure lysosomal Na+.

a, Fluorescence images (left) show RatiNaAT (DNA, magenta) colocalized with lysosome markers (cyan), LMP-1 in C. elegans and TMR-dextran (Dex) in RAW macrophages. Percentage colocalization of RatiNaAT in lysosomes (right) in n = 9 coelomocytes and n = 8 RAW cells in two independent experiments. b, Ratiometric images of RatiNabiotin on beads (upper panels) and RatiNa-labeled, Na+ clamped C. elegans lysosomes (lower panels) at the indicated Na+ levels. Cell outline shown in white. c, G/R values increase with increasing Na+ on beads (grey, n = 100–150) and in worm lysosomes (ochre, n = 50–75). d, Linear fits of normalized G/R values of RatiNa as a function of [Na+] on beads (grey), in C. elegans lysosomes (ochre) and in RAW macrophages (cyan). Inset shows RatiNa response from 5 to 145 mM Na+. All experiments performed in triplicate. Absolute Na+ heatmaps of single, native, RatiNa-labeled lysosomes in C. elegans and RAW macrophages imaged in the CG (cyan) and ATTO647 (magenta) channels. Na+ values in single lysosomes of RAW macrophages and C. elegans coelomocytes (n = 100–150 lysosomes from 35–50 cells). Experiments were performed in triplicate and data from each trial is colour coded. Mean value of each trial is given by a filled circle of the corresponding colour63. Lysosomes with Na+ values < 5 mM are shown below the break in the Y-axis (n = 21 and 17 for RAW cells and C. elegans). All error bar represents mean values ± SD.
