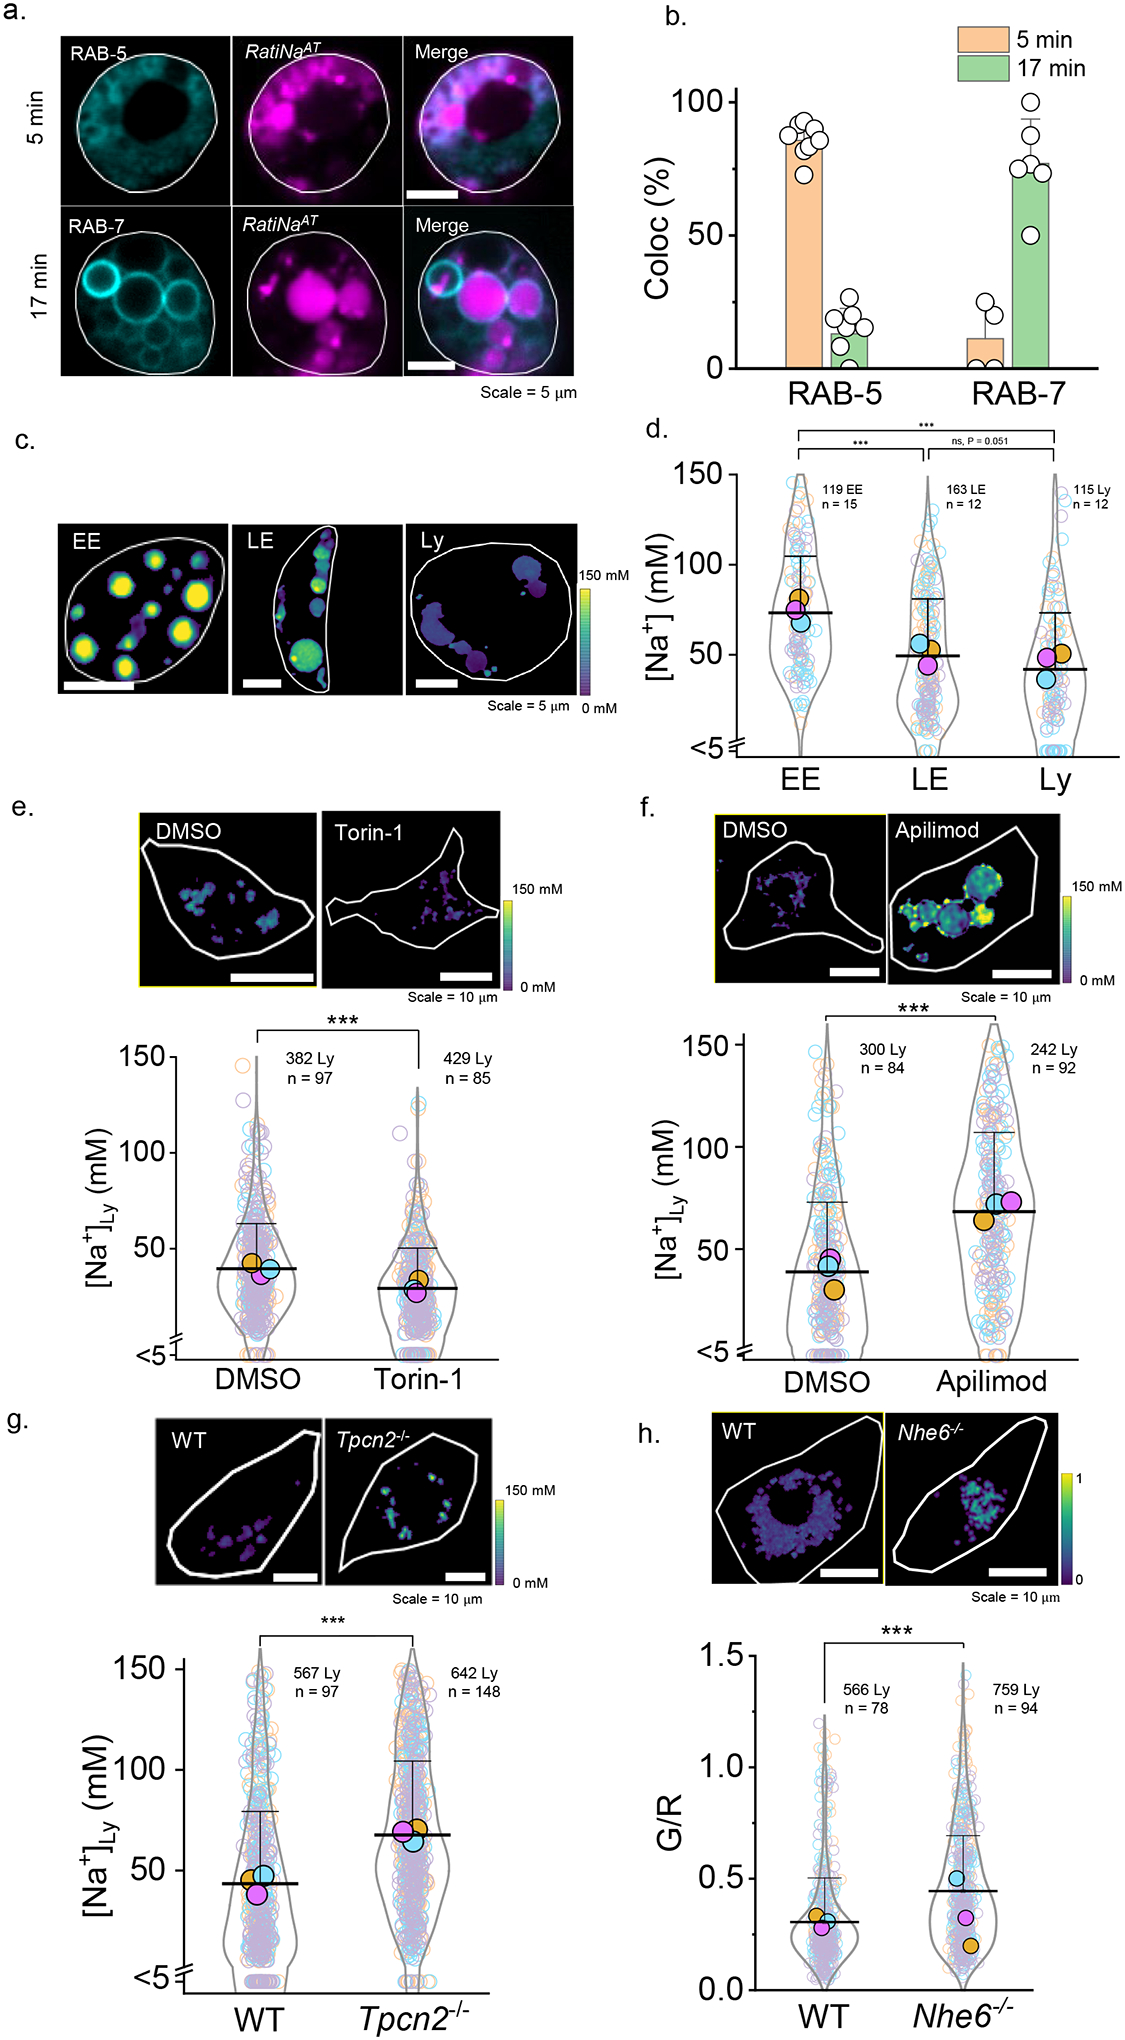
Figure 3 |. RatiNa captures physiological changes in organellar Na+.

a, RatiNaAT (magenta) colocalizes with early endosome (EE) marker, RAB-5-GFP (cyan), and late endosome (LE) marker, RAB-7-GFP (cyan), time-dependently in C. elegans coelomocytes. b, Quantification of colocalization between RatiNaAT and the indicated markers at 5 min (n = 8, 4 coelomocytes) and 17 min (n = 7, 6 coelomocytes) respectively. Data are presented as mean values ± SD. c, RatiNa maps lumenal Na+ levels at each stage of endosomal maturation in coelomocytes of N2 C. elegans. Images are taken at 5 min, 7 min and 40 min post microinjection. d, Na+ levels decrease as endosomes mature with the biggest change from EE to LE. (n = 115–163 endosomes/lysosome from 12–15 worms). P = 2.6E-13 for EE to Ly, 7.7E-10 for EE to LE and 0.051 for LE to Ly. e, Pharmacological inhibition of mTOR with Torin-1 (1 mM) reduces lysosomal Na+. P = 9.3E-11. f, Pharmacological inhibition of TPCN2 by apilimod (100 nM) elevates lysosomal Na+ in RAW macrophages. Lysosomal Na+ is elevated in g, RAW264.7 macrophages where Tpcn2 is knocked out and h, in bone marrow derived macrophages from Nhe6−/− mice (n = 300–759 lysosomes from 84–148 cells). P = 1.3E-19, 7.5E-30, 5.5E-27 for f, g, h. *P ≤ 0.05; **P ≤ 0.01; ***P ≤ 0.001; ns, no statistical significance. Data in d-f are presented as mean values, error bars represent SD and two sample two-tailed t-test was used for statistical analysis assuming equal variance.
