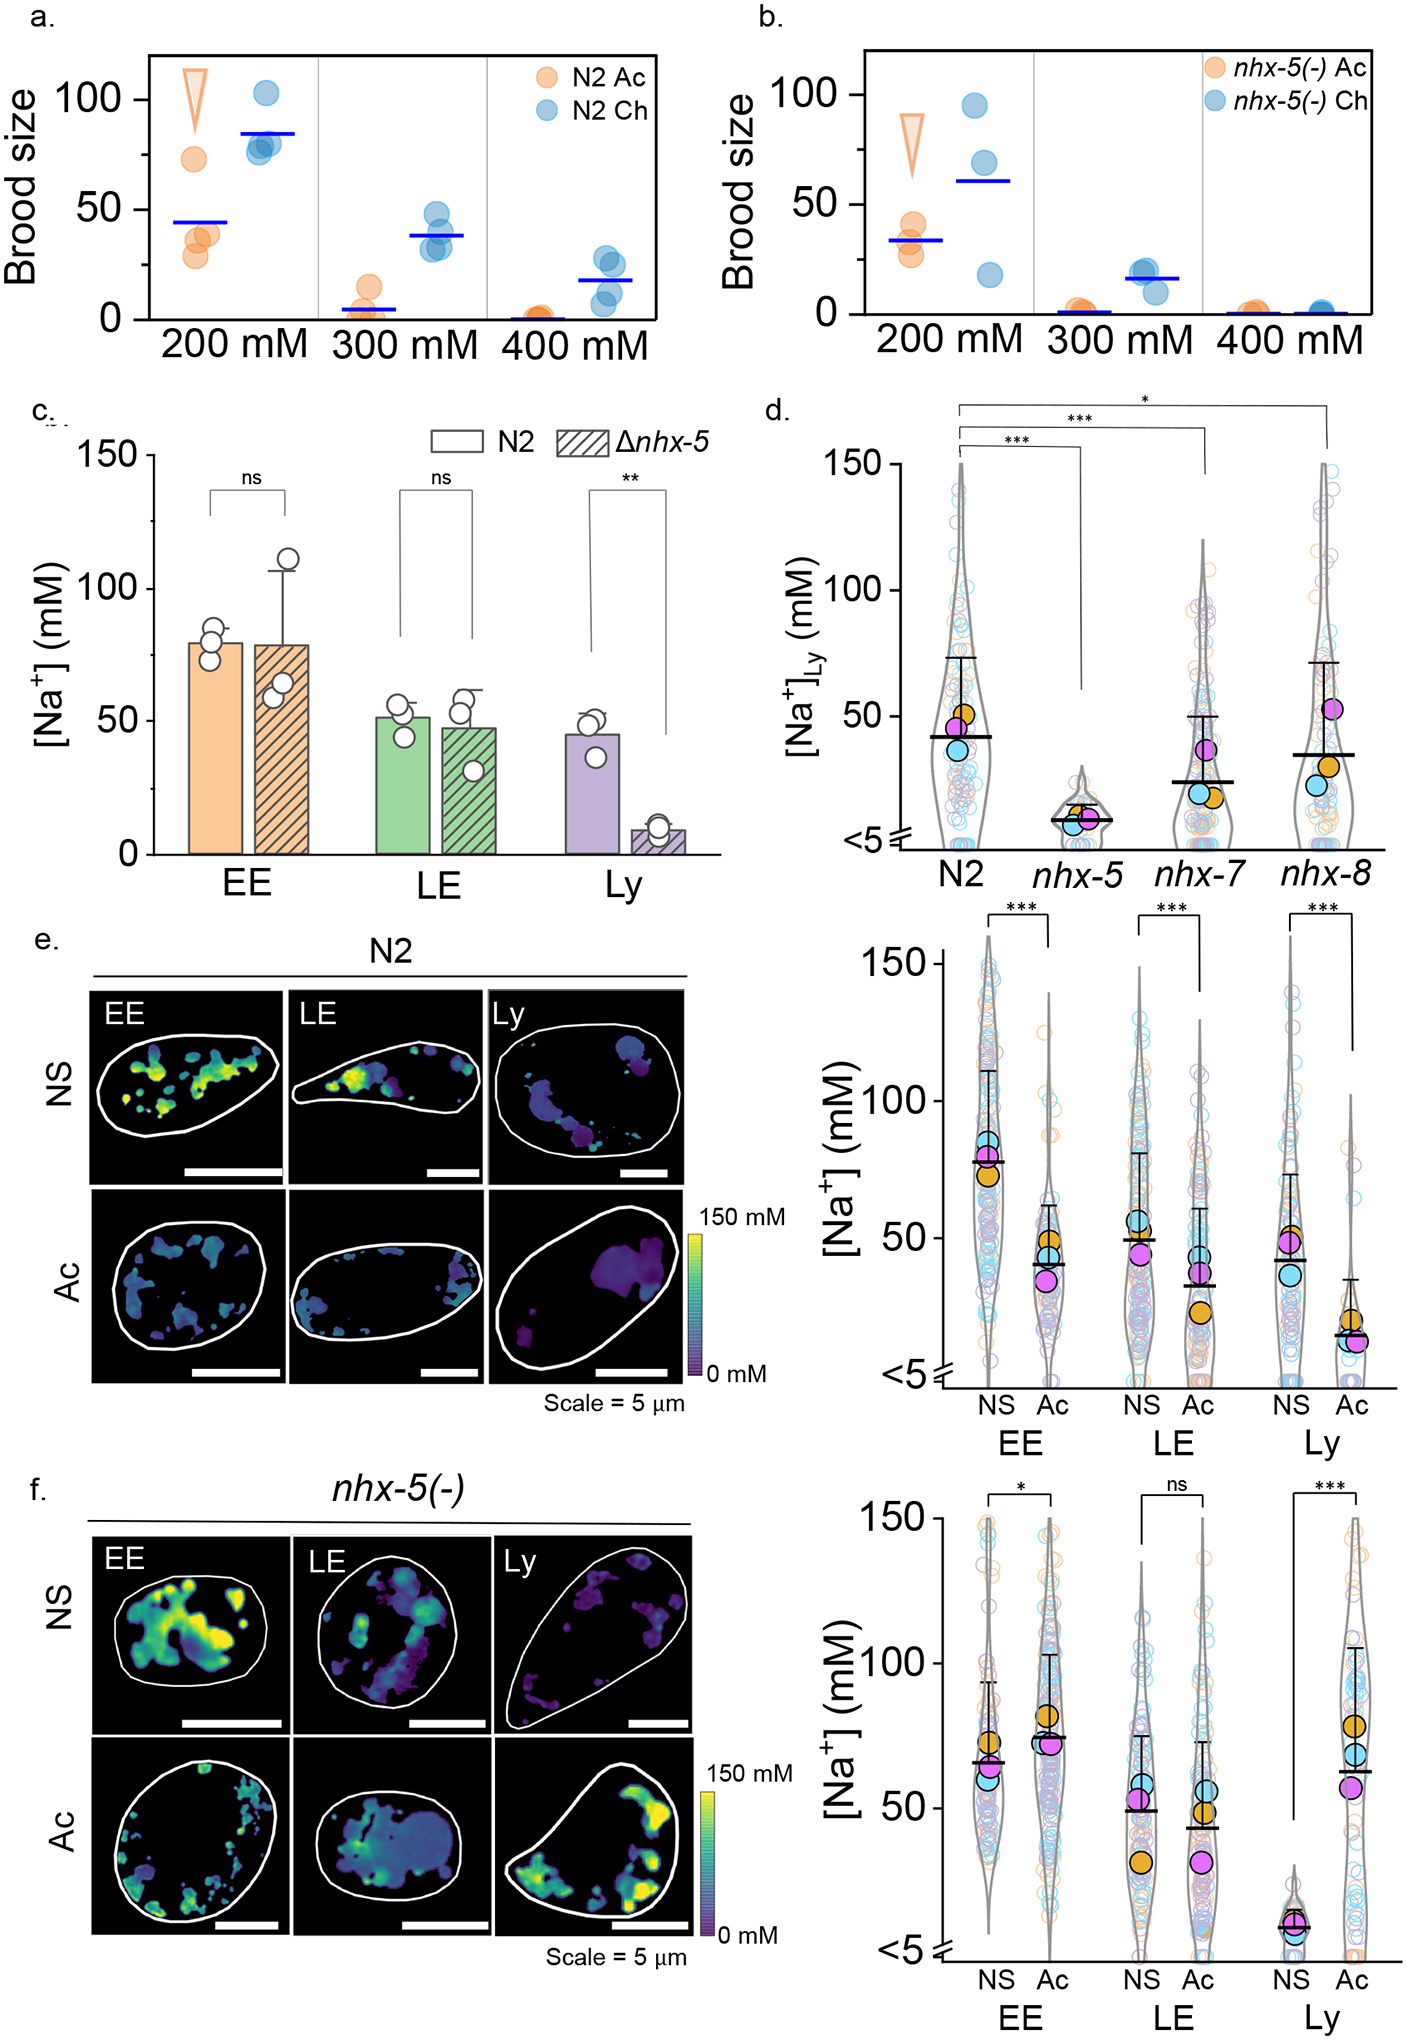
Figure 4 |. Lysosomal Na+ transport is vital for salt adaptation in C. elegans.

a,b, Brood size of acutely (Ac) and chronically salt stressed (Ch) N2 and nhx-5 (−) worms for the indicated salt levels. Arrows indicates condition used for lysosomal Na+ measurement in salt stressed worms is acute 200 mM c, Lumenal Na+ levels at each stage of the endolysosomal pathway in N2 and nhx-5(−) worms in normal salt (NS). Note that nhx-5(−) worms show lower Na+ levels only in lysosomes (Ly) and not in early (EE) or late endosomes (LE). P = 0.95, 0.71, 1.5E-3 for EE, LE, Ly d, In worms lacking the indicated nhx genes, Na+ levels in single lysosomes are affected specifically by loss of nhx-5. Levels in n = 100–150 lysosomes from 12–16 worms. For nhx-5 (−) alone, n=41 lysosomes, 6 worms. P = 1.4E-10, 2.2E-7, 0.11 for N2 to nhx-5 (−), nhx-7 (−), nhx-8 (−). e, f, Lysosomal Na+ reduces upon chronic salt stress in N2 worms but increases in nhx-5 (−) worms. Lumenal Na+ levels at each endosomal stage in normal salt (NS) and acutely (Ac) salt stressed N2 (e) and nhx-5(−) (f) worms. Cell outline is shown in white. All experiments were performed in triplicate and data from each trial is colour coded. Mean value of each trial given by a filled circle of the corresponding colour58. P = 8.9E-19, 2.7E-6, 2.2E-6 for EE, LE, Ly in N2 and P = 0.01, 0.09, 2.1E-13 for EE, LE, Ly in nhx-5(−) worms. For all trials, n = 130–160 organelles from 8–12 worms. Only for Ac N2 and NS nhx-5(−) worms, data is from n = 40 lysosomes from 6 worms. Data in c-f are presented as mean values, error bars represent SD and two sample two-tailed t-test was used for statistical analysis assuming equal variance.
