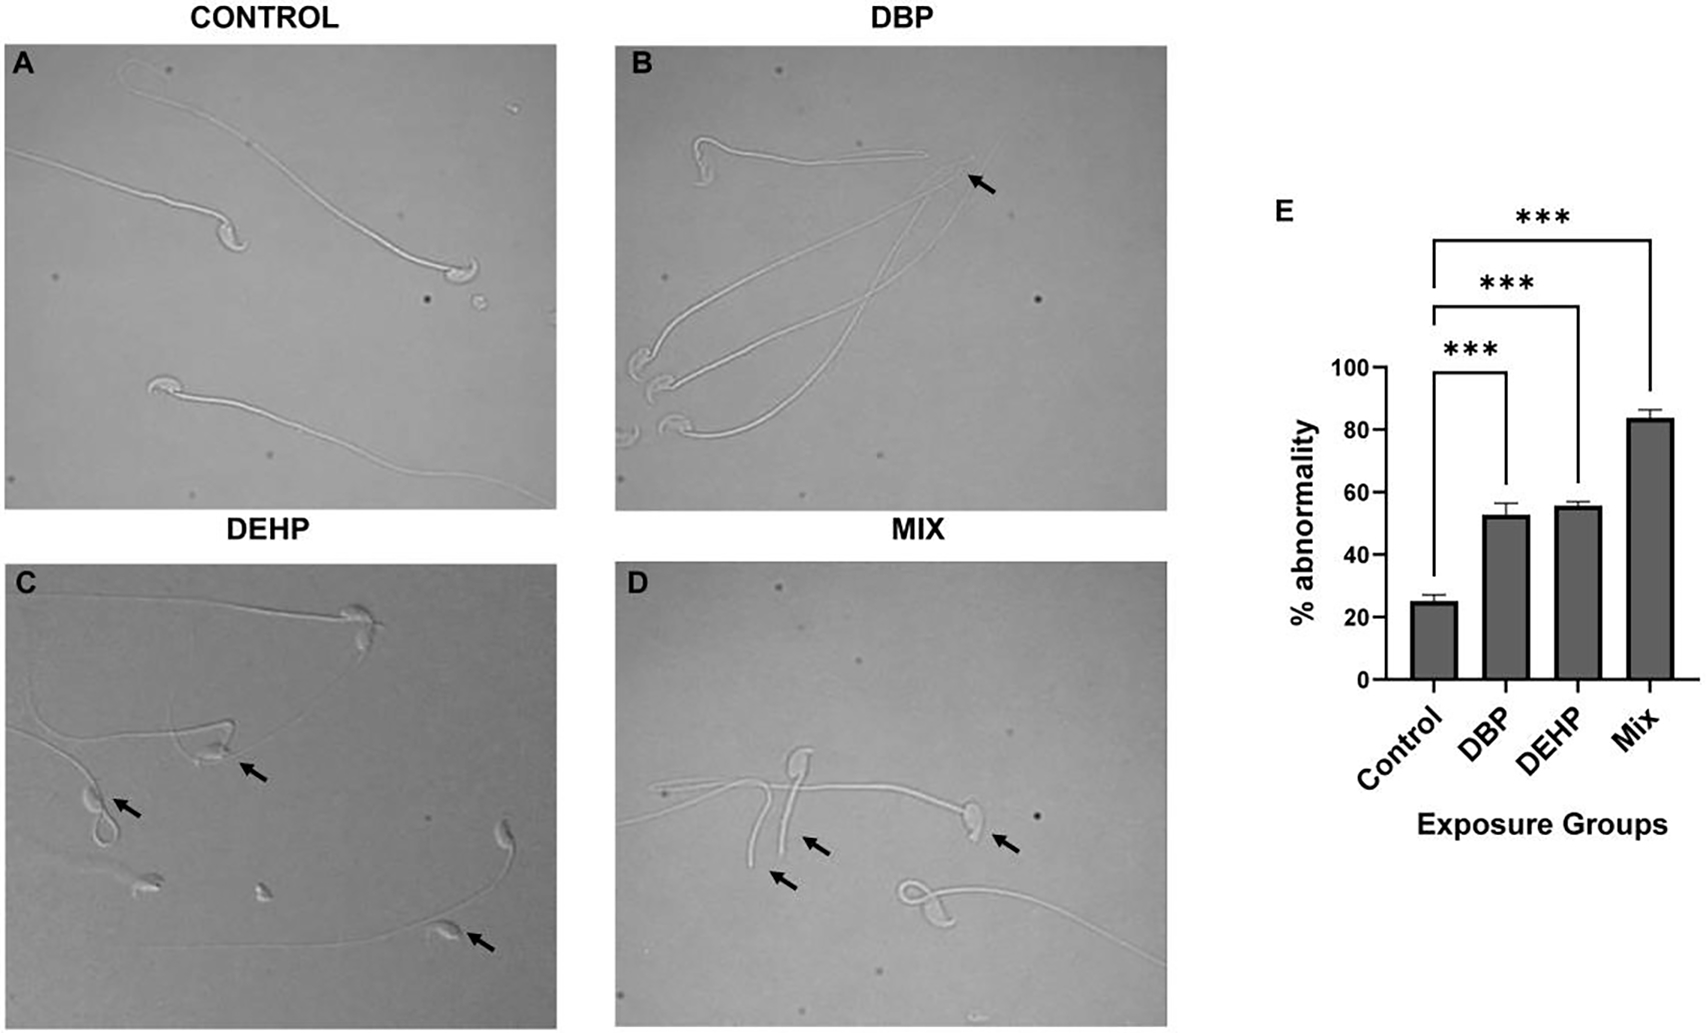
Figure-2: Sperm morphology. Aliquots obtained as described in Fig. 1 were used to assess sperm morphology.

using differential interference contrast (DIC) microscopy. A-D: Representative images of abnormal morphology in the different exposure groups. Arrows indicate some of the examples of abnormal morphology. For all exposure conditions a minimum of 100 spermatozoa per sample was counted for morphology evaluation. Data are represented as mean percentage of abnormal sperm ± SEM (N=6). A one-way ANOVA was performed followed by Dunnett test for multiple comparisons p< 0.001 (***), considered as statistically significant. Data were compared to the Control group only.
