Figure 5.
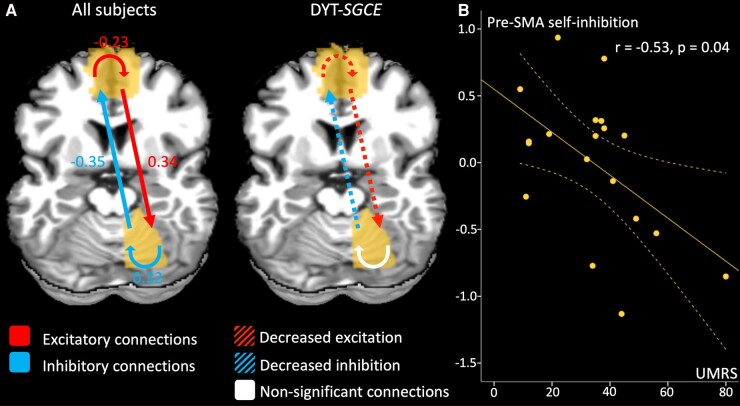
Dynamic causal model effective connectivity results. (A) The contribution of different parameters to model evidence across all subjects (left) and between groups (right). Parametric Empirical Bayes (PEB) employs Bayesian statistics. Consequently, the outcomes do not rely on P-values but are presented in terms of posterior probabilities (pp). The connections with a posterior probability (pp) > 0.99 are displayed in colour whereas the non-relevant connections are displayed in white. For the contrast of the whole group of participants, the effect size of the connectivity parameters are displayed. For between-region parameters (in Hz), positive numbers indicate excitation and negative numbers indicate inhibition. For self-connection parameters (no units), positive numbers indicate self-inhibition and negative numbers indicate disinhibition. These effects between regions and within regions are summarized by red arrows for excitatory connection and blue arrow for inhibitory connections. For the between groups contrast, we displayed the connections that differentiate groups in colour. Since the contrast patients > healthy volunteers indicate different outcomes depending on if parameters are positive or negative, we chose to summarize the results as follows: the red dotted arrows represent decreased excitatory connections, and blue dotted arrows represent decreased inhibitory connections. (B) Partial correlation accounting for the effect of age, sex, total intracranial volume, framewise displacement in DYT-SGCE group with 95% CI of self-inhibition within pre-supplementary motor area on y-axis (corrected for covariable of non-interest) and Unified Myoclonus Rating Scale on x-axis (r = −0.53, P = 0.04). DYT-SGCE, myoclonus dystonia; pre-SMA, pre-supplementary motor area; UMRS, Unified Myoclonus Rating Scale.

