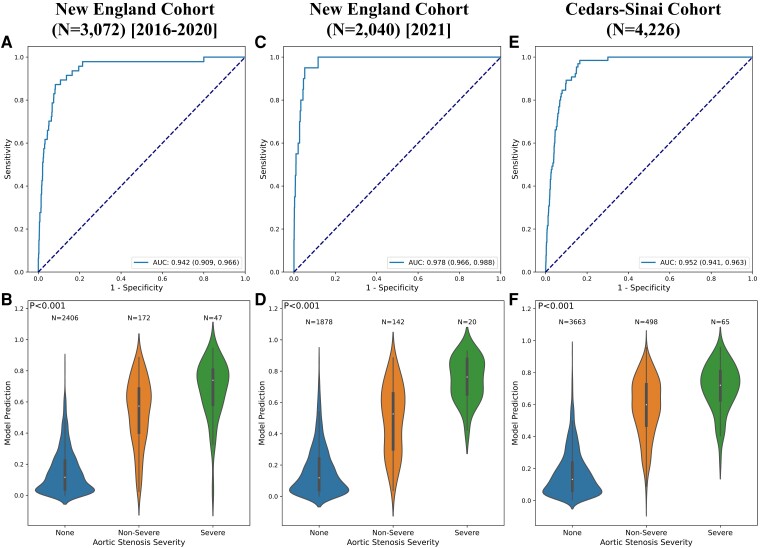
Figure 3.
Model performance in the external validation sets. Receiver operating characteristic curves (first row) and violin plots showing relationship of model output with aortic stenosis severity (second row) for the external New England cohort (first column), temporally distinct New England cohort (second column), and external Cedars-Sinai cohort (third column)

