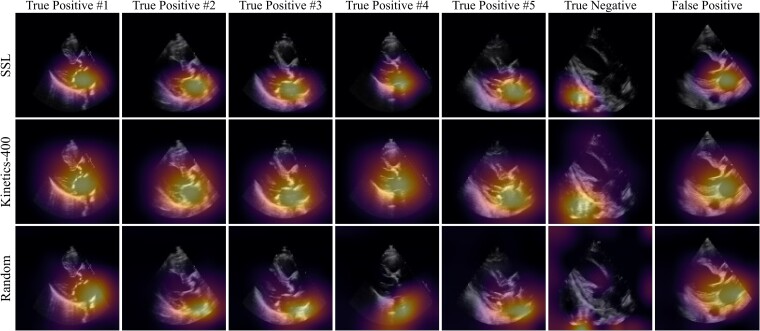
Figure 4.
Saliency map visualization. Spatial attention maps for the self-supervised learning (SSL)-pretrained model (top row), Kinetics-pretrained model (middle row), and randomly initialized model (bottom row) for five true positives (first five columns), a true negative (sixth column), and a false positive (last column). As determined by the Kinetics-pretrained model, the first five columns represent the five most confident severe AS predictions, the sixth column represents the most confident ‘normal’ (no severe AS) prediction, and the seventh column represents the most confident incorrect severe AS prediction. Saliency maps were computed with the GradCAM method and reduced to a single 2D heatmap by maximum intensity projection along the temporal axis

