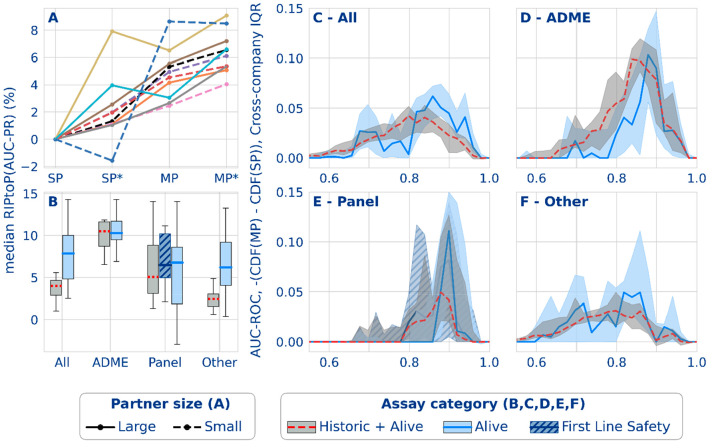
Figure 4.
Classification performance results from the federated run. (A) Effect of multipartner (MP) and auxiliary data (*) on the median AUC-PR task performance for 5 smaller (dashed lines) and 5 larger (solid lines) partners. (B) Distribution of median AUC-PR task performance (RIPtoP(AUC-PR)) over partners. (C–F) Difference between the empirical cumulative distribution functions (CDFs) from single- and multipartner models for different assay types based on AUC-ROC. The difference between the cumulative proportion of tasks in the multi- versus single-partner models (y-axis) is shown for the binned performance (x-axis). The line plots indicate the median probability difference for that bin over all partners. The interquartile ranges are indicated by the shaded envelope. Mind that AUC-ROC is shown here due to its stable baseline of 0.5 for a random classifier.

