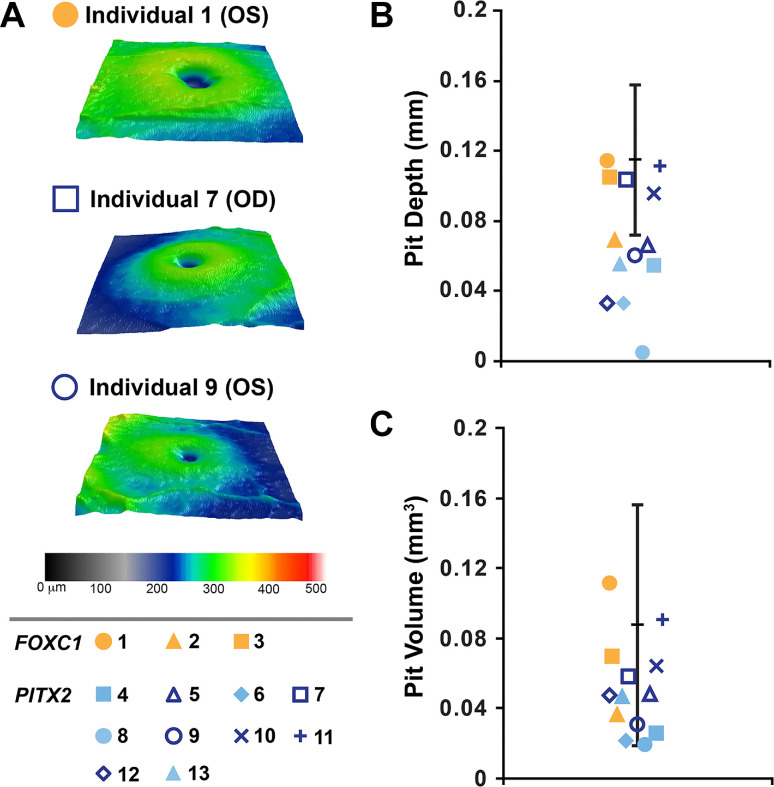
Figure 4.
Foveal comparisons. (A). Foveal pit images showing variability among non-hypoplastic foveal pits. Largest (individual 1), intermediate (individual 7), and smallest (individual 9) non-hypoplastic pit images were chosen. (B, C) Plotting of foveal pit depth and volume demonstrates a statistically significant decrease in both metrics compared to normal controls for PITX2-ARS (blue symbols) but not FOXC1-ARS (yellow symbols). The normal range from control individuals is indicated by black lines in B and C. The symbol assigned to each individual is indicated in the lower left corner.

