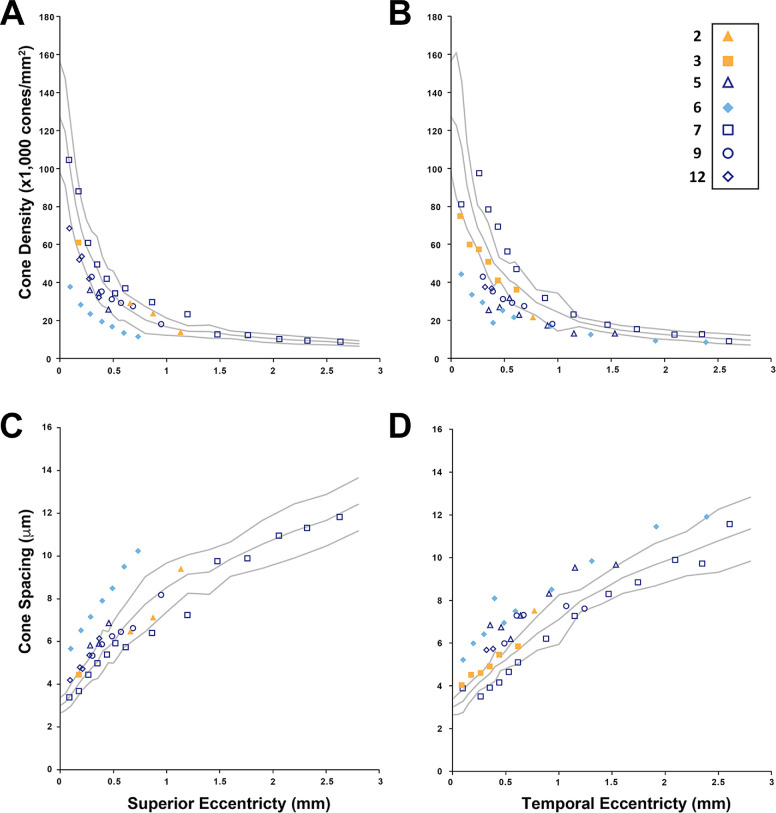
Figure 6.
Cone mosaic analysis. Cone density (A, B) and spacing (C, D) were determined from AOSLO images from individuals with PITX2-ARS (blue symbols) and FOXC1-ARS (yellow symbols) along both the superior (A, C) and temporal (B, D) eccentricity. Only individual 6 (with foveal hypoplasia) had values consistently outside the normal range. The symbol assigned to each individual is indicated and consistent with Figure 4 (but AOLSO data are only available for a subset of participants).

