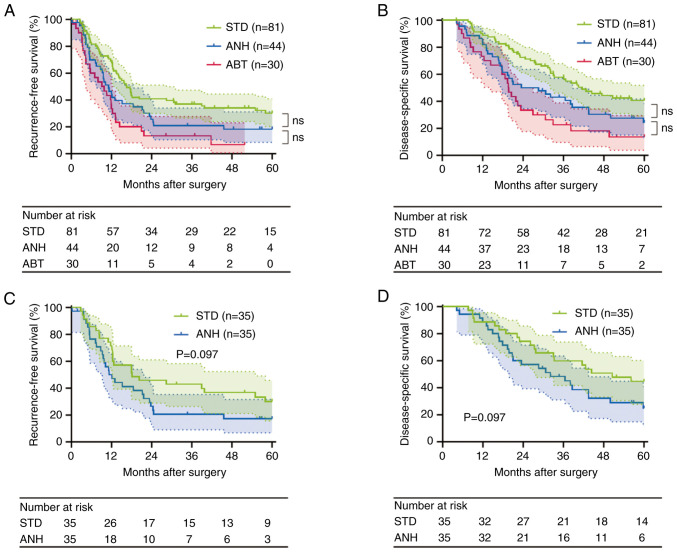
Figure 2.
Survival analysis. (A and B) Survival cures of the STD, ANH and ABT groups for the entire cohort. (A) Recurrence-free survival (STD vs. ANH, P=0.043; ANH vs. ABT, P=0.143; log-rank test, before applying Bonferroni correction; after correction: STD vs. ANH, P=0.129; ANH vs. ABT, P=0.429). (B) Disease-specific survival (STD vs. ANH, P=0.029; ANH vs. ABT, P=0.136; log-rank test, before applying Bonferroni correction; after correction: STD vs. ANH, P=0.087; ANH vs. ABT, P=0.408). (C and D) Survival cures of the STD and ANH groups in the propensity score-matched cohort. (C) Recurrence-free survival (P=0.097; log-rank test). (D) Disease-specific survival (P=0.097; log-rank test). ABT, allogeneic blood transfusion; ANH, acute normovolemic hemodilution; ns, not significant; STD, standard management.

