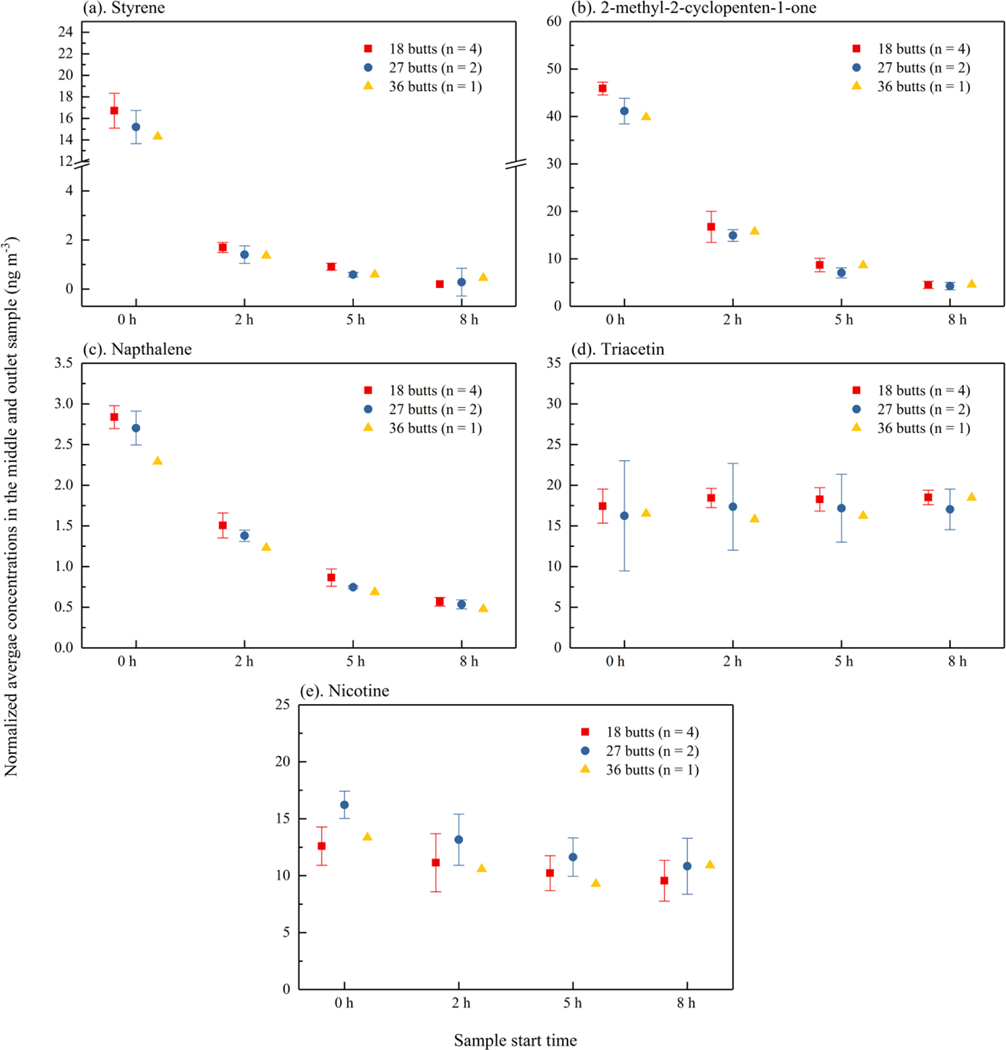
Figure 2.
Normalized average concentrations in the middle and outlet sample (ng m−3) taken at 0h, 2h, 5h, and 8h. (a) styrene, (b) 2-methyl 2-cyclopenten-1-one, (c) naphthalene, (d) triacetin and (e) nicotine. Error bars show one standard deviation for data with 18 butts, and relative percentage difference for data with 27 butts.

