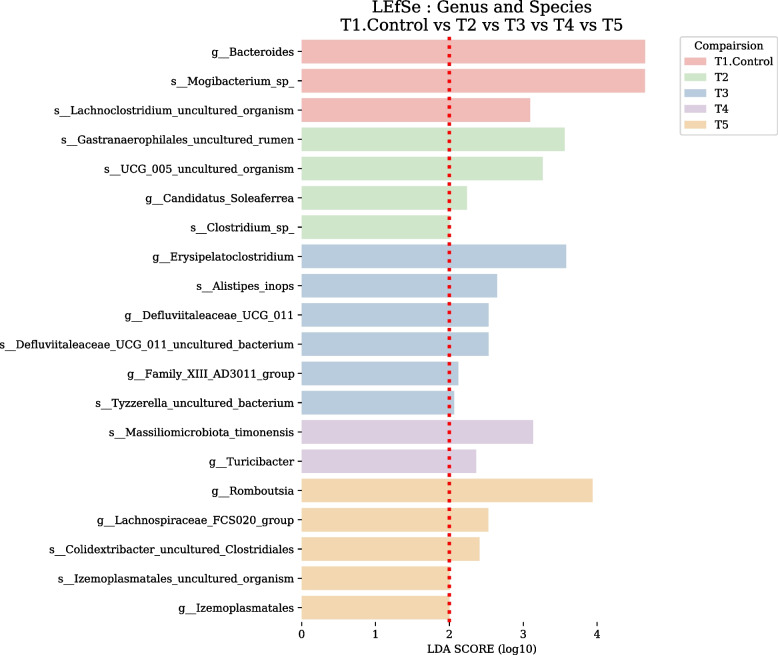
Fig. 5.
Linear discriminant analysis effect size (LEfSe) identified the most differentially abundant taxa enriched in ileum microbiota of broilers among the groups on d 35. T1: negative control groups, NC (basal diet); T2: positive control groups, PC (basal diet supplemented with 0.1% probiotics); T3: muramidase groups, MR (basal diet supplemented with 0.035% microbial muramidase); T4: precision glycan groups, PG (basal diet supplemented with 0.1% precision glycan); T5: mixture of MR and PG group, MRPG groups (basal diet supplemented with 0.025% microbial muramidase + 0.1% precision glycan)

