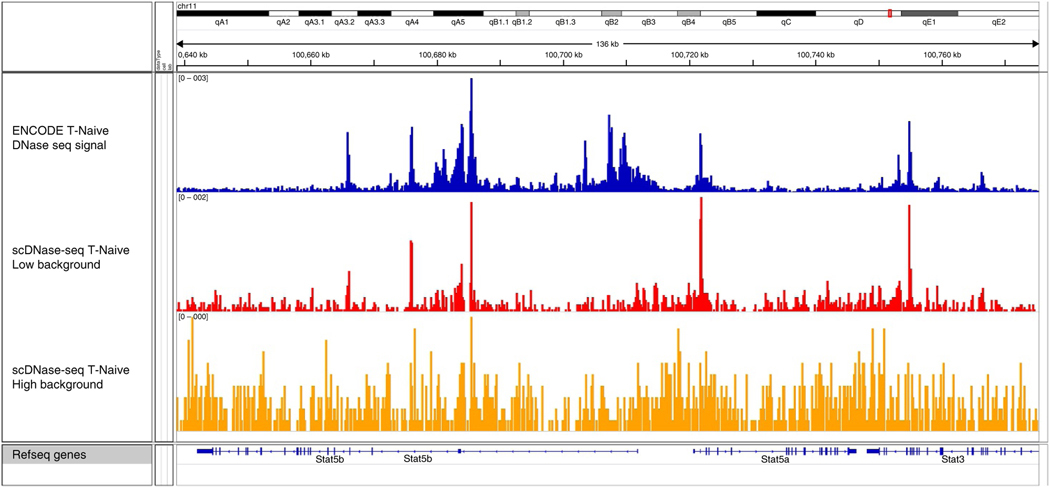
Figure 4 |.
Representative IGV genome browser images of scDNase-seq experiments using cells of differing viabilities22. Both scDNase-seq tracks (red and orange) are derived from 5,000 mouse naive CD4+ T cells using the 0.3 U/μl DNase I enzyme concentration, with 95 and 80% viable cells, respectively. The top track is from the ENCODE (accession no. GSM1014192) project and shows the highest signal-to-noise ratio23. The lower background seen in the red track is the result of starting with cells with higher viability, and this track is similar to conventional DNase-seq results. The presence of apoptotic cells in a library (orange track, 80% viable cells) increases the background and substantially reduces the sensitivity and specificity of scDNase-seq.

